
Chapter 12: Urban and Suburban Spaces
12.5 Internal City Structure
12.5.1 Modeling Land Value
12.5.1.1 The Van Thunen Model

Source: “Von Thunen Model” by Ytx21cn via Wikimedia Commons is licensed under CC0 1.0.
Before investigating how cities are internally structured, it is illustrative to view the Von Thunen model and its hinterland. In 1826, Johann Heinrich von Thunen created an economic model of how the area around the city from which resources are gathered (the hinterland) is organized. Two key points of this economic model become analogous for economic rationale for how cities are theorized to organize. First, this model showed that proximity to the city came with a premium on price due to desirability. This meant that land uses nearest to the city had to be the most profitable in order to afford land rent. Second, the resulting organization of the hinterland is in concentric rings with more profitable products closer and less profitable products further from the center. As an economic model, these outcomes are contingent upon several assumptions, none of which are truly realistic. However, it models an idealized form that is altered and complicated by the complexity of local and regional geographies in all locations. The assumptions are:
- The City is in the center of an isolated State; it is a single market
- The hinterland itself is surrounded by “wilderness”; combined with the prior assumption, it means that there are no connections or products coming to this region or being exported out of the region
- Land is ubiquitous; there are no differences in soil type, topography, or climate, and no water features. All environmental factors are equal everywhere
- Farmers transport their own products to market using an ox cart without roads; roads change the ubiquity of land and therefore don’t exist
- Farmers behave rationally in order to maximize profits; farmers seek the most profitable use of their land
Given these assumptions, von Thunen predicted that certain types of production (or land use) would dominate certain rings. The inner-most ring would be dedicated to dairy production and market gardening. Both categories of agriculture are bulky to transport, can potentially spoil quickly (this is before the invention of refrigeration), and have relatively high productivity per acre in terms of sale price. As such, farmers both can afford the more expensive land, and need proximity in order to get products to market. The next ring is wood for fuel. As with dairy/gardening, it is bulky and hard to transport, but does not produce as much value per acre, therefore it occupies less expensive land. Following fuel wood is a ring of grains and field crops. This produce needs many acres, but cannot merit a large market value per acre planted. Grains however store well and do not need to come to market immediately after ripening. Farmers therefore need larger quantities of cheaper land, and are willing to travel further to market due to a lack of immediate spoilage. The last ring is ranching and livestock. Livestock is transported easily to market, so proximity is not necessary. As well, though an individual cut of meat may be more expensive than the products mention above, meat production is the least profitable per acre. It may take years to raise livestock to the proper age for butchering and it takes vast amounts of grazing land for the larger animals. For these reasons, ranching is furthest from the market and the last agricultural ring before wilderness.
12.5.1.2 The Land Value Model

Source: “Bid rent1” by SyntaxError55 via Wikimedia Commons is licensed under CC BY-SA 3.0.
When it comes to cities, similar economic models are used to look at basic spatial structural patterns. A land value model of urban land uses is one such example. In this model, land values are estimated based on bid rent. Bid rent is the amount of money an individual parcel of land can receive for any land use. While true bid rents are based on a function of site and situation s(attributes of the parcel itself and its location/ accessibility), the land value model simplifies reality through these assumptions:
- There exists a prime value intersection (PVI); the central point of a city with the highest amount of access;
- Access from all other places to the PVI is based solely on distance; no transportation network effects;
- All sites are ubiquitous; site advantages like hills, ocean views, and others do not exist;
- There is no zoning or planning for particular land uses; land use is based on market forces only.
With these assumptions, we get the formula: Bid Rent = Land Value at PVI – Access Costs
Source: “Bid Rent” by crosenfe and Nathan Burtch via Pressbooks Human Geography is licensed under CC BY-NC-SA 4.0.
Different land uses have different attenuating effects of distance. In other words, some land uses must have high access, and others can have further distance from the PVI and still be profitable. Land uses have different bid rent curves , or different slopes, affected by accessibility. The image to the left is a rough demonstration of this concept. In this simplified model, there are four land uses: office, retail, industry, and residential. Each has a different bid rent curve on the basis of access costs. Office space, where corporate headquarters locate, need access and connectivity, and are also quite profitable. The office bid rent curve then is the steepest; office land uses are willing to pay a premium for the most access, and are unwilling to pay if access decreases too much. Retail likewise wants access, for walk-in shoppers and increased customer traffic, but while profitable are not as profitable as office space. Retail land uses then won’t pay the extreme premium of office space, and is willing to have slightly less access. Industry also desires centrality, but generally needs more parcel space than is affordable near the PVI. Industrial land uses are less profitable and need lower rents that have less accessibility. Residential uses have the lowest profitability but also have little stake in needing prime access, and have the shallowest bid rent curve.
As a result, whichever land use is willing to pay the most at each location becomes the land use of that location. This is the “highest and best use” of the land. The result are rings of development based on distance. The gray lines on the image show the distance break points when one dominant land use cedes to another that is willing to pay the highest rent. The center ring is office, then retail, then industry, then residential. At a certain distance, residential land uses too are far from the PVI that rent could be $0 and residences still won’t be built. Think of it this way; if someone offered you a free house, but it was 500 miles from your work or school, you probably wouldn’t live there! The access costs of commuting would be too great.
12.5.2 Internal City Structures of the North American City
The contemporary North American scene dramatically displays how its population has refashioned the settlement landscape to meet the needs of a modern postindustrial society. In North American cities, a city’s center, commonly called downtown, has historically been the nucleus of commercial and services land use. It is also known as the central business district (CBD), usually being one of the oldest districts in a city and the nodal point of transportation routes. The CBD gives visual expression to the growth and dynamic of the industrial city, becoming a symbol of progress, modernity, and affluence. It contains the densest and tallest nonresidential buildings and its accessibility attracts a diversity of services.

Source: “Burgess model” via Wikimedia Commons is in the public domain.
Urban decentralization also reconfigured land-use patterns in the city, producing today’s metropolitan areas. If during the first half of the 20th century the concentric zone model was idealized, in which urban land is organized in rings around the CBD. The model was the first to explain why certain groups of people lived in certain areas of the city and he envisioned it by drawing hypothetical concentric zones.
These were starting at the center:
- The Central Business District – the center of the city
- A zone of mixed use with both commercial buildings and residential ones.
- Low-class residential homes. These were later called inner suburbs – housing is cheap, standard of living is low.
- Higher-class residential zone; later called outer suburbs. Better quality of life, more expensive to live there.
- Commuter zone

Source: Photo by Barbara Crain, CC BY 4.0.

Source: “Hoyt model” by Cieran 91 via Wikimedia Commons is in the public domain.
A simplified version of the Sector Model is shown in Figure 12.5.6. This model suggests that cities typically expand in sectors rather than concentric rings. It proposes that similar groups tend to form clusters that grow outward together. Despite this sectoral growth, the Central Business District (CBD) remains at the core of the model.

Source: “Multiple nuclei model” via Wikimedia Commons is in the public domain.
The third and final urban design is called the multiple nuclei model. (See figure 12.5.7) In this model, the city is more complex and has more than one CBD. A node could exist for the downtown region, another where a university is situated, and maybe another where an international airport may be. Some clustering does exist in this model because some sectors tend to stay away from other sectors. For example, industry does not tend to develop next to high-income housing.
The multiple nuclei model also features zones common to the other models. Industrial districts in these new cities, unfettered by the need to access rail or water corridors, rely instead on truck freight to receive supplies and to ship products, allowing them to occur anywhere zoning laws permitted. In western cities, zoning laws are often far less rigid than in the East, so the pattern of industrialization in these cities is sometimes random. Residential neighborhoods of varying status also emerged in nearly random fashion as well, creating “pockets” of housing for both the rich and poor, alongside large zones of lower middle-class housing. The reasons for neighborhoods to develop where they do are similar as they are in the sector model. Amenities attract wealthier folks, transport advantages attract industry and commerce, and disamenity zones are all that poor folks can afford. There is a sort of randomness to multiple nuclei cities, making the landscape less legible for those not familiar with the city, unlike concentric ring cities that are easy to read by outsiders who have been to other similar cities.

Source: “MapofEmergingUSMegaregions” by IrvingPlNYC via Wikimedia Commons is licensed under CC BY-SA 3.0.
Beyond the city: Metropolitan clusters produce uneven patterns of settlement across North America. Eleven urban agglomerations, also known as megalopolises, exist in the United States and Canada, 10 of them being located in the United States (Figure 12.5.8).

Source: “Northeast megalopolis at night” by NASA Earth Observatory/NOAA NGDC via Wikimedia Commons is in the public domain in the United States.
The Boston–Washington Corridor, or BosWash, with its roughly 50 million inhabitants, (= 15%of the U.S. population) is the most heavily urbanized region of the United States (Figure 12.5.9). The region, located on less than two percent of the nation’s land area, accounts for 20 percent of the U.S. GDP!
Like many other cities in the core regions, North American cities are also recognized for their prosperity. Yet, some problems still exist such as fiscal squeeze (less money from taxes), poverty, homelessness, neighborhood decay, and infrastructureneeds. By contrast, some inner cities experience the process of gentrification, invaded by higher-income people who work downtown and who are seeking the convenience of less expensive and centrally located houses, larger and with attractive architectural details.
12.5.3 Internal City Structures of the Latin American City
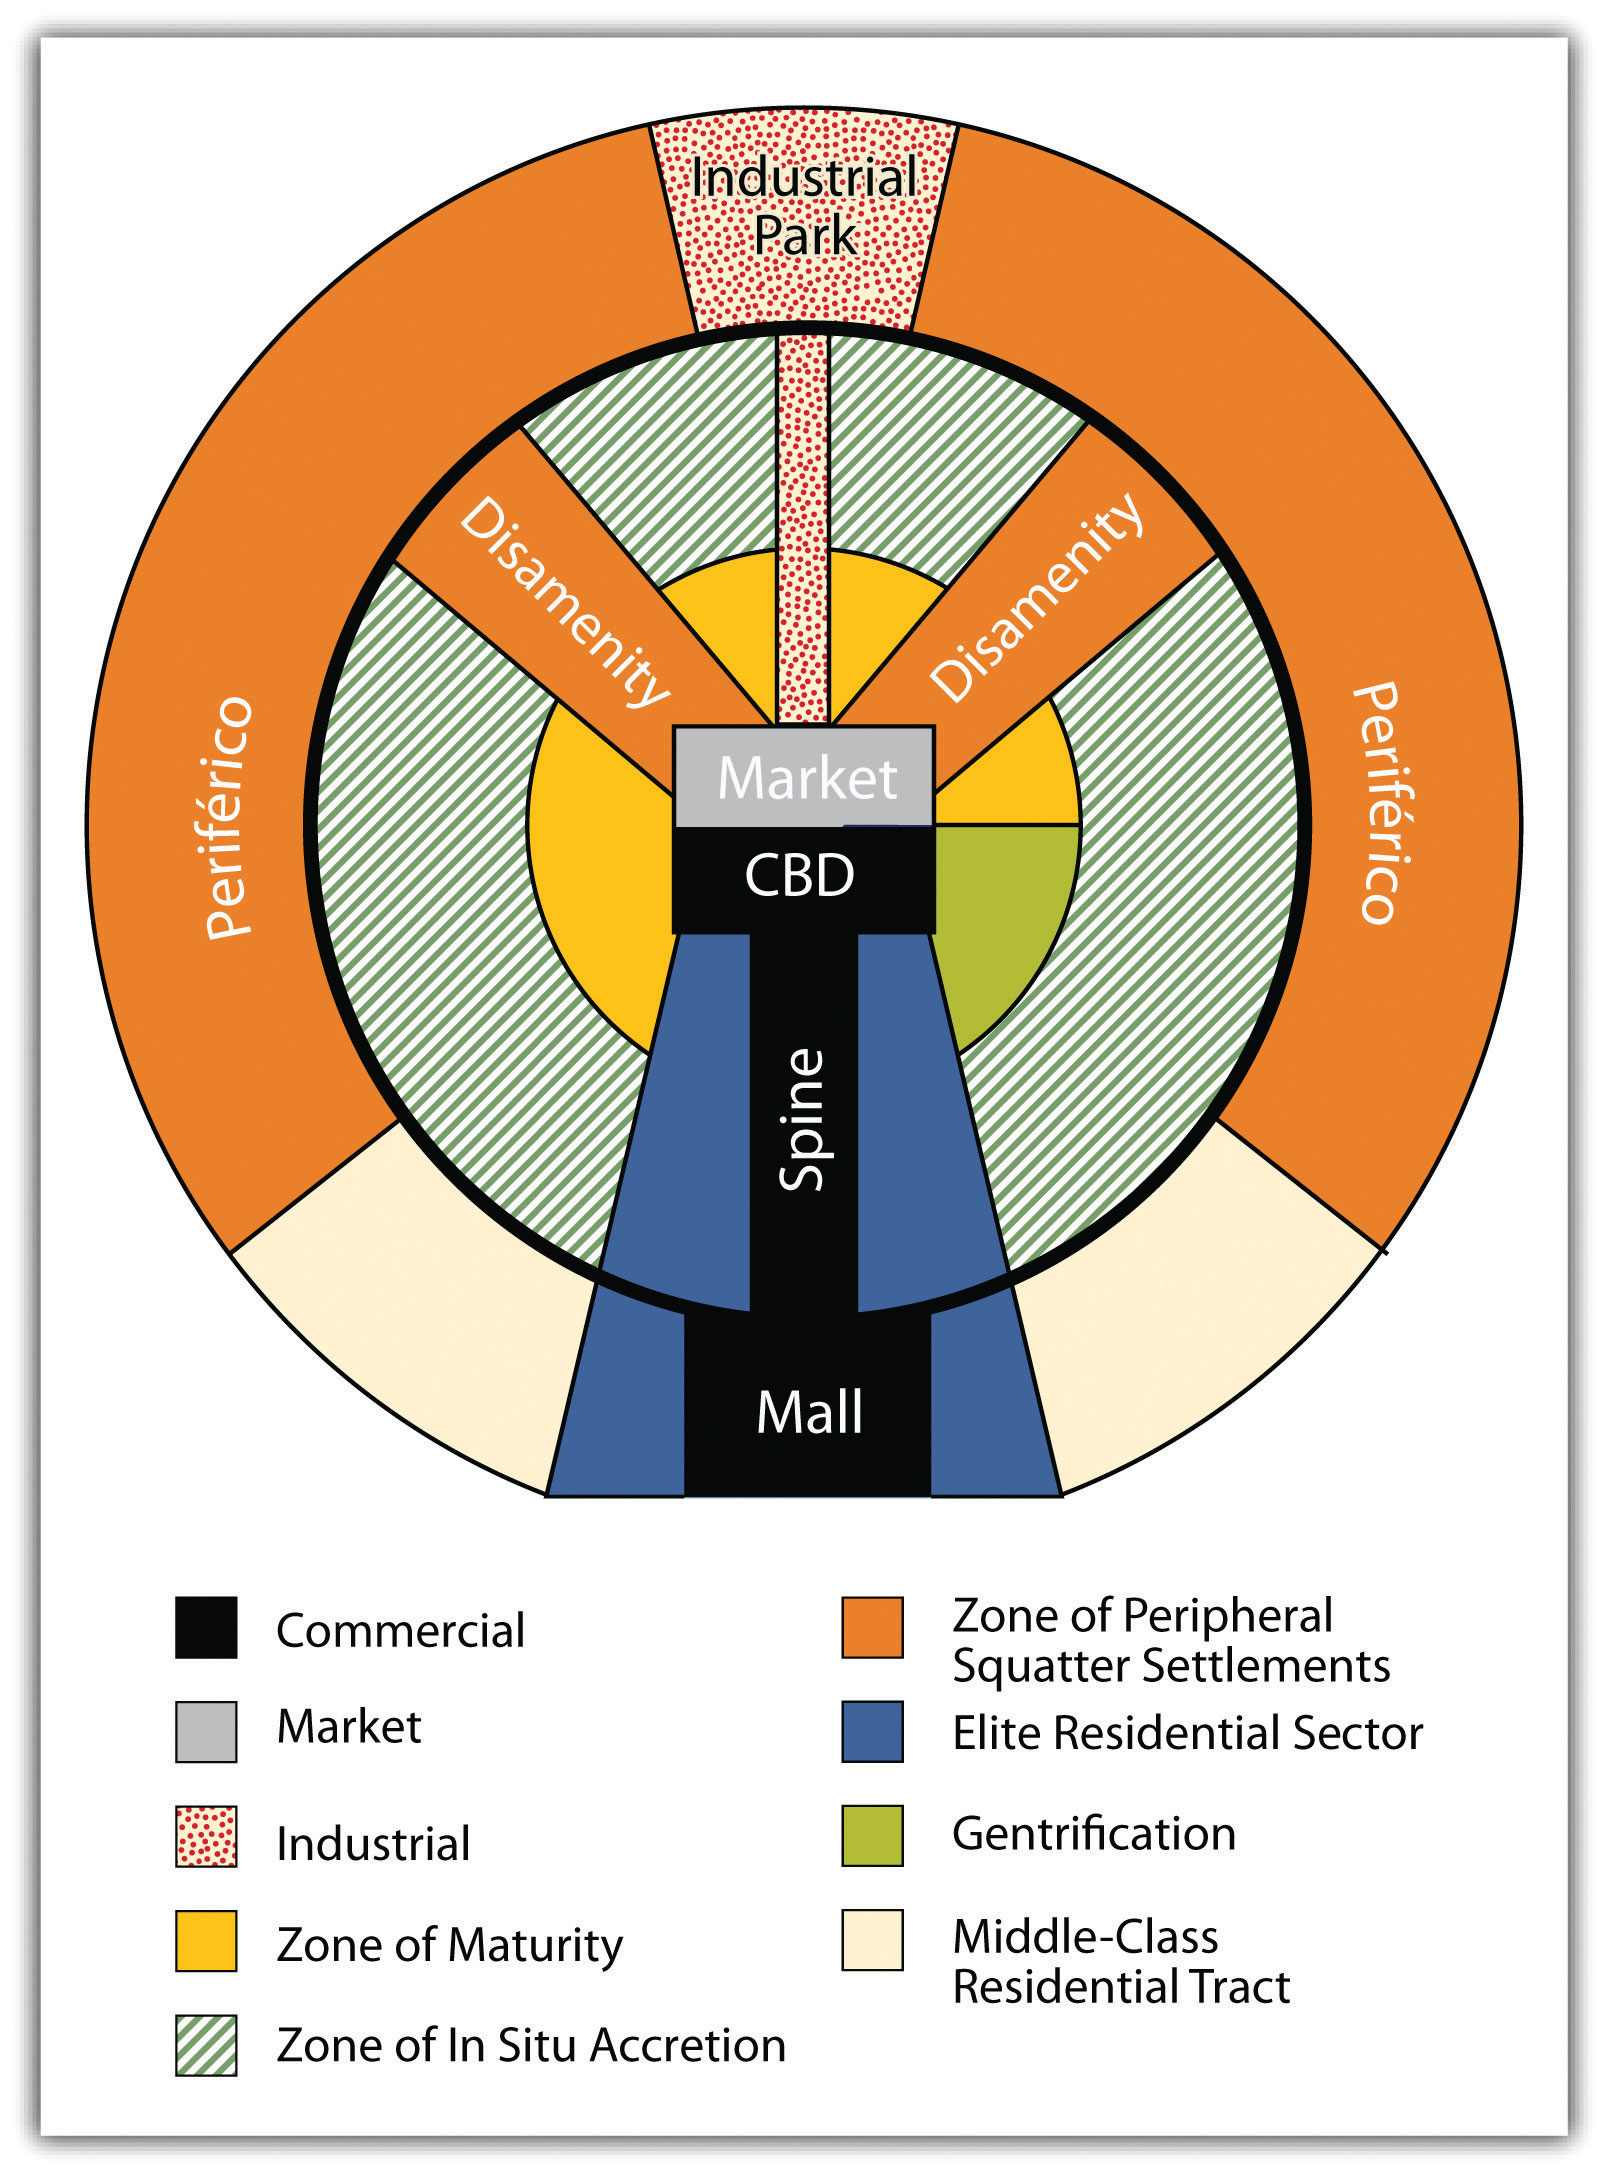
Source: “Spanish-American City Structure According to the Ford-Griffin Model” by Royal Berglee, PhD via Pressbooks World Regional Geography is licensed under CC BY-NC-SA 4.0.
Geographers Ernest Griffin and Larry Ford recognized that the popular urban models did not fit well in many cities in the developing world. In response, they created one of the more compelling descriptions of cities formerly colonized by Spain – the Latin American Model (Figure 12.6.7). The Spanish designed Latin American cities according to rules contained in the Spanish Empire’s Law of the Indies. According to these rules, each significant city was to have at its center a large plaza or town common for ceremonial purposes. A grand boulevard along which housing for the city’s elite was built stretched away from the central plaza and served as both a parade route and opulent promenade. For several blocks outward from this elite spine was built the housing for the wealthy and powerful. The rest of the city was initially left for the poor because there was almost no middle class. The poorly built houses close the central plaza where jobs and conveniences existed. Over time, the houses built by the poor, perhaps little more than shacks, were improved and enlarged. Ford and Griffin called this process in situ accretion. As the city’s population grew, young families and in-migrants built still more shacks, adding rings of housing that is always being upgraded. At the edges of the city are always the newest residents, often squatting on land they do not own.
12.5.4 Internal City Structures of the European City
One characteristic of Europe is its high level of urbanization. Even in sparsely settled Northern Europe, over 80 percent of the people live in urban area (Iceland 94 percent)6. Southern and Eastern Europe are the least urbanized, with an average of 69-70 percent. While widespread urbanization is relatively recent in Europe, dating back only a century or two, the spread of cities into Europe can be associated with the classical Greek and Roman Empires, making many cities in Europe more than 2,000 years old. Among the largest metropolitan areas are Paris (10.9 mill.), London (10.4 mill.), and Madrid (6.1 mill.)7. European cities, like North American cities, reflect the operation of competitive land markets and they also suffer from similar problems of urban management, infrastructure maintenance, and poverty. Yet, what makes most European cities distinctive in comparison with North American cities is their long history, being the product of several major epochs of urban development.
Source: Photo by Barbara Crain, CC BY 4.0.
The three zone models (concentric, sector, and multiple nuclei) characterizing North American urban areas are also valid in Europe, but there are significant differences regarding the spatial distribution of social groups, who may not have the same reasons for selecting particular neighborhoods within their cities. The European Central Business Districts (CBDs), for example, are inhabited by more residents than CBDs of the United States, most of them being higher-income people attracted by the opportunities to have access to commercial and cultural facilities, as well as to occupy beautiful old buildings located in some elegant residential districts. As a result, European CBDs are less dominated by business services than American CBDs. CBDs are, in general, very expensive urban areas. Consequently, poor people are more likely to live in outer rings in European cities.
Source: Photo by Barbara Crain, CC BY 4.0.
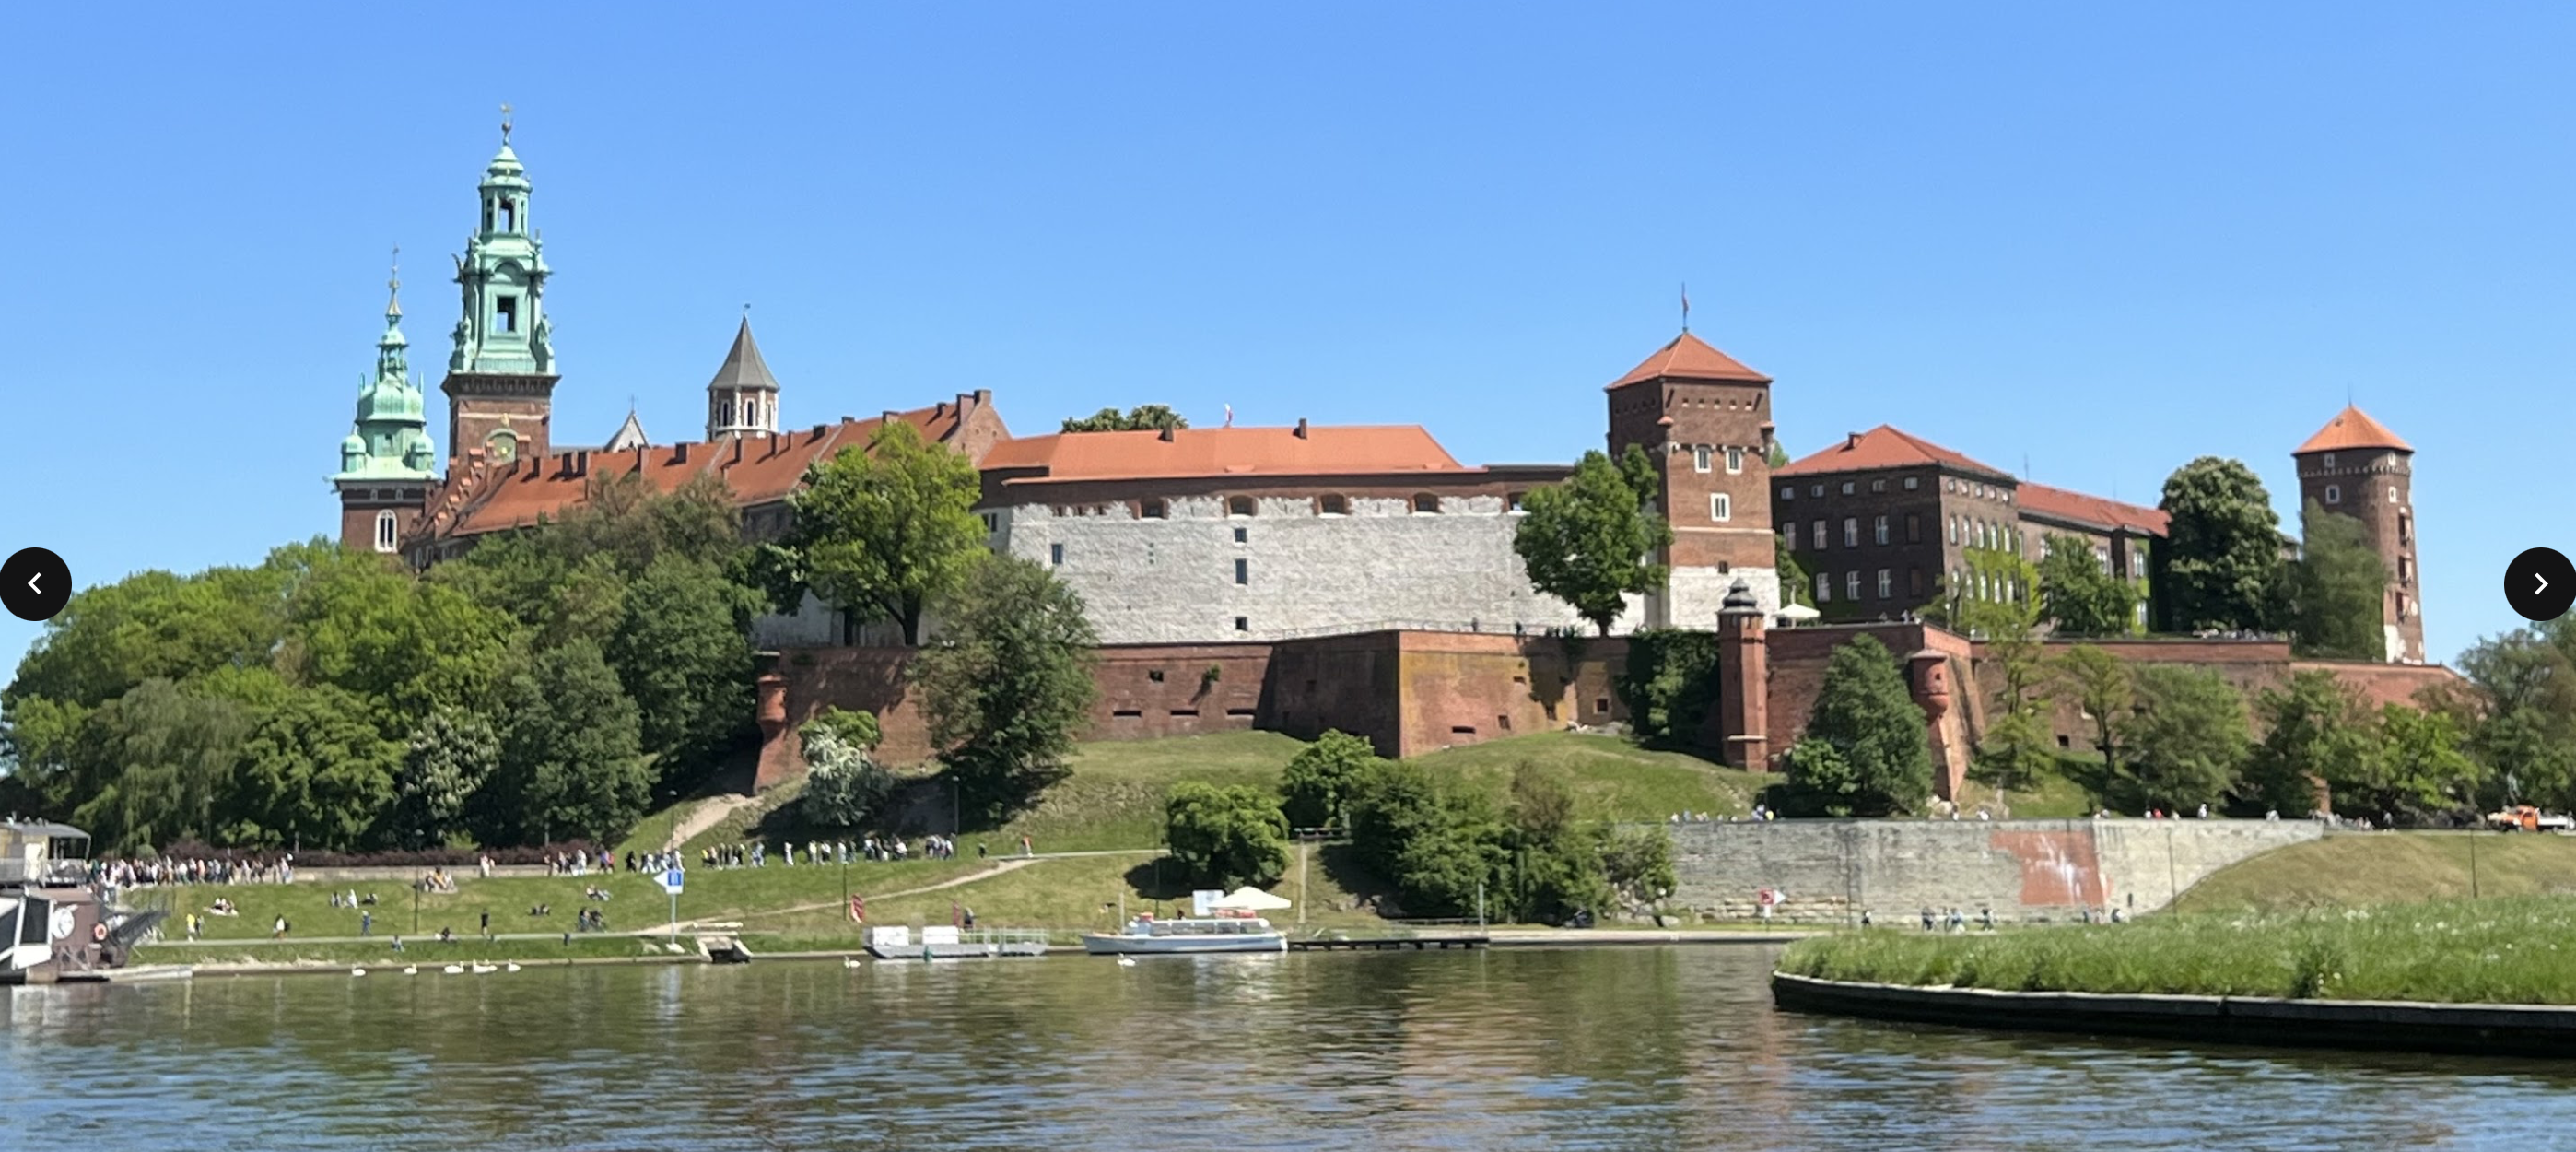
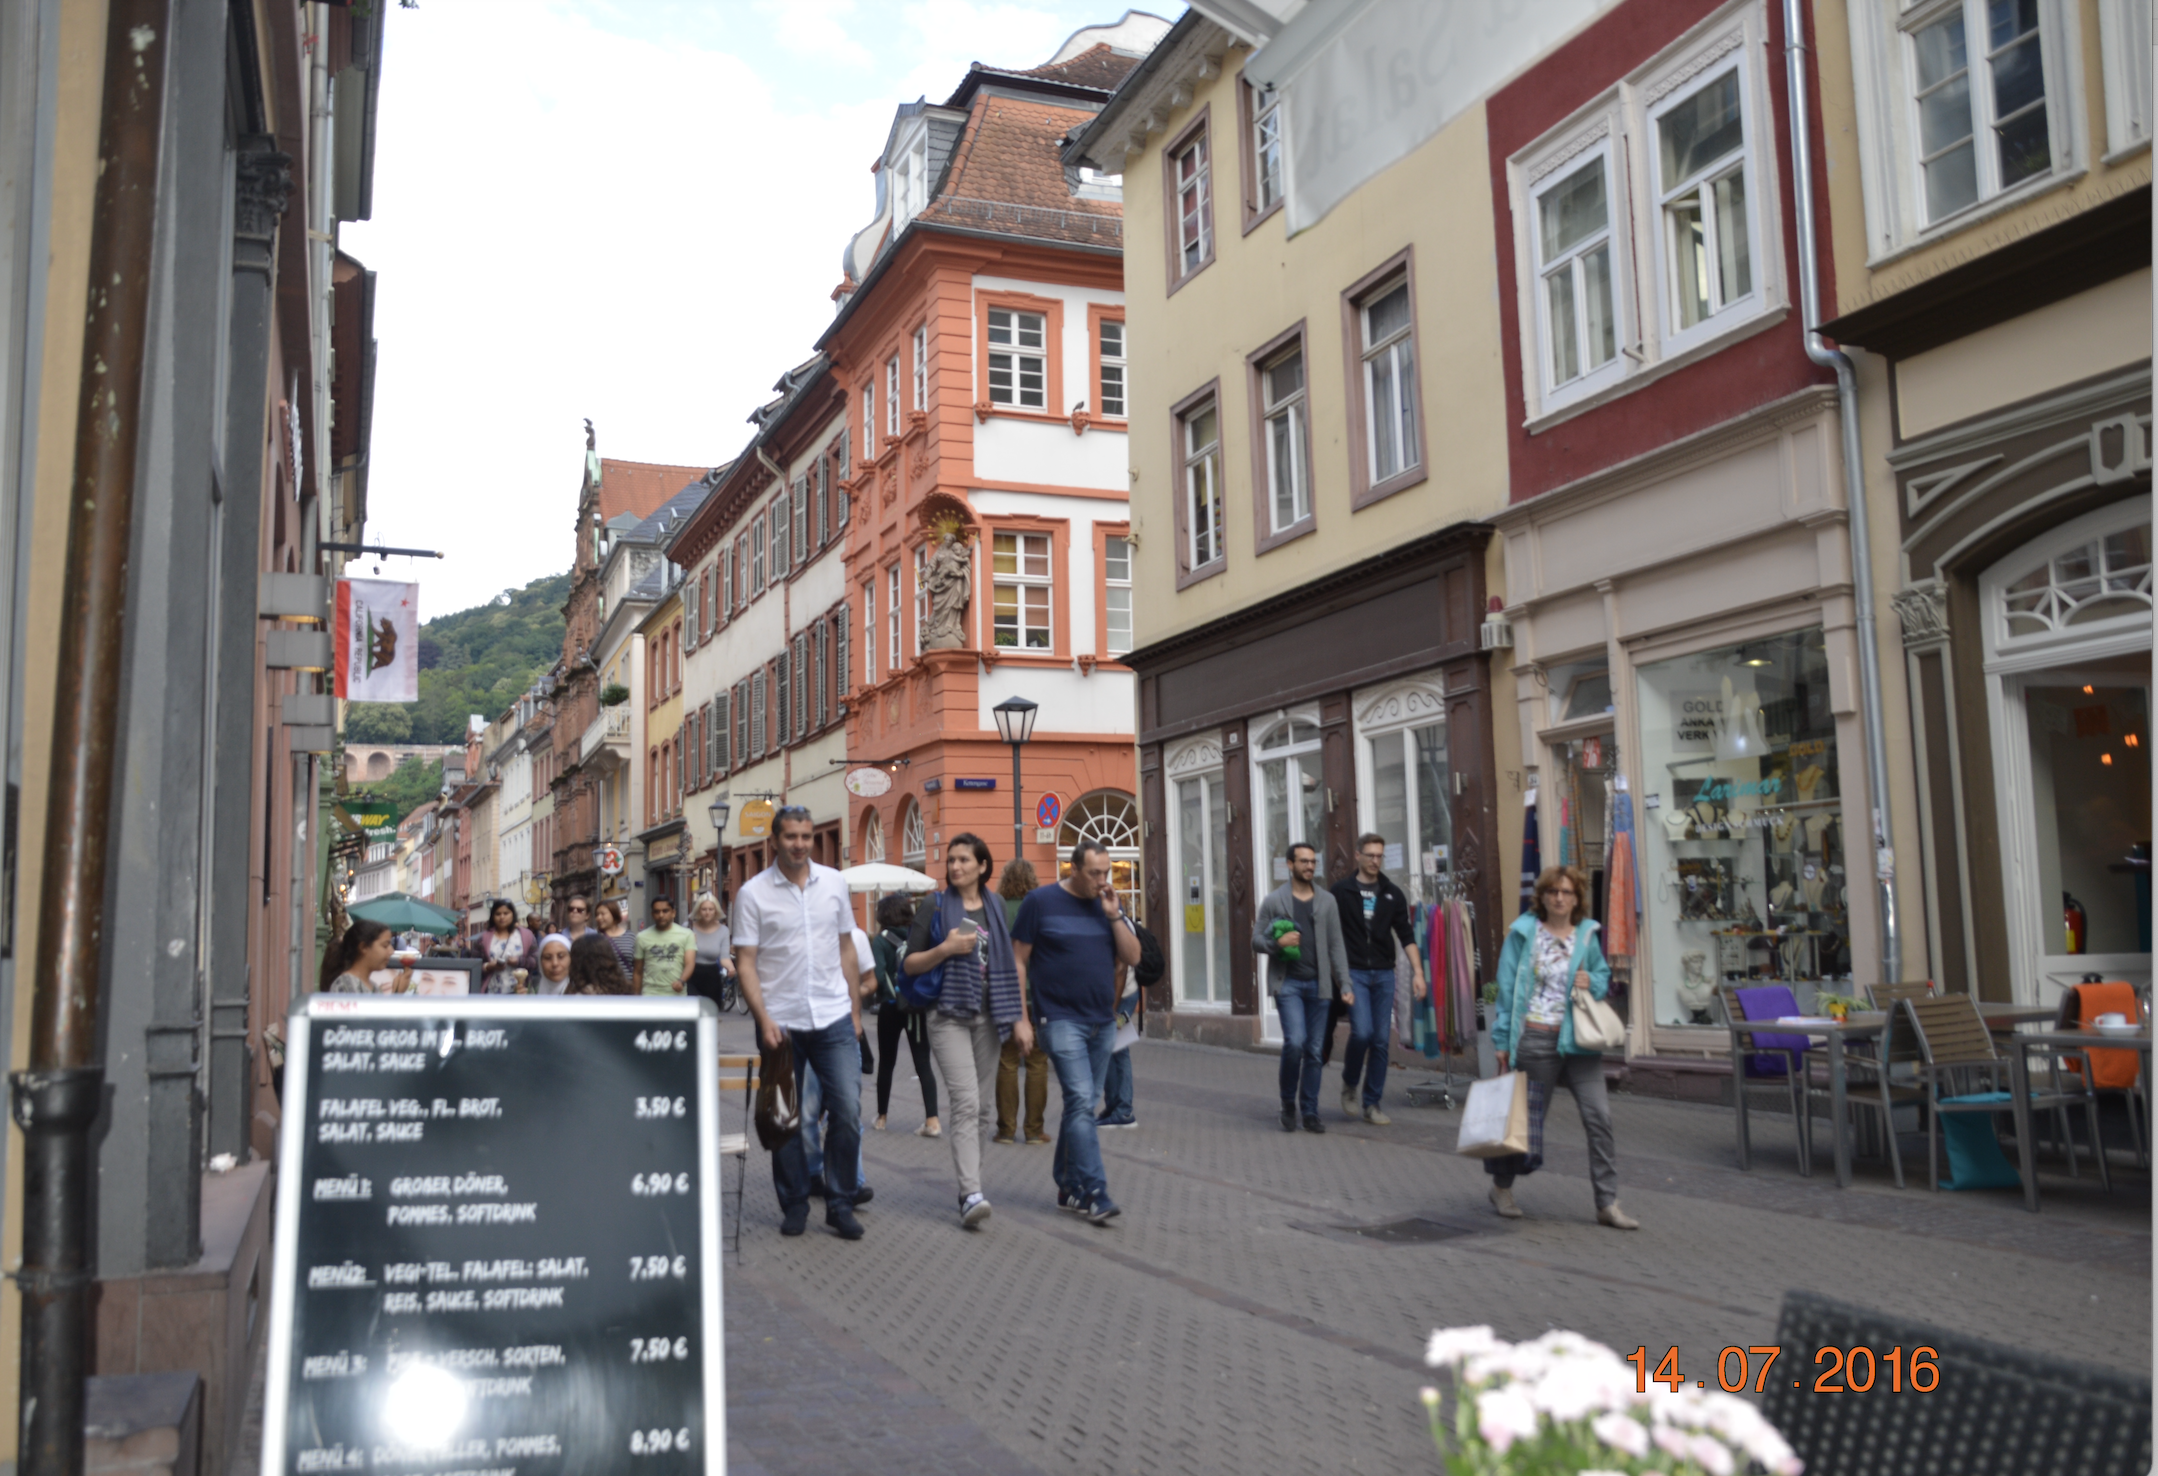
Because many of today’s most important European cities were founded in the Roman and medieval periods, there are strict rules for preservation of their historicCBDs, such as banning motor vehicles, maintaining low-rise structures, plazas, squares, and narrow streets, and preserving the original architecture, including the former cities’ walls. Impressive palaces, cathedrals, churches, monasteries, accompanied by a rich variety of symbolism—memorials and statues—also constitute the legacy of a long and varied history.
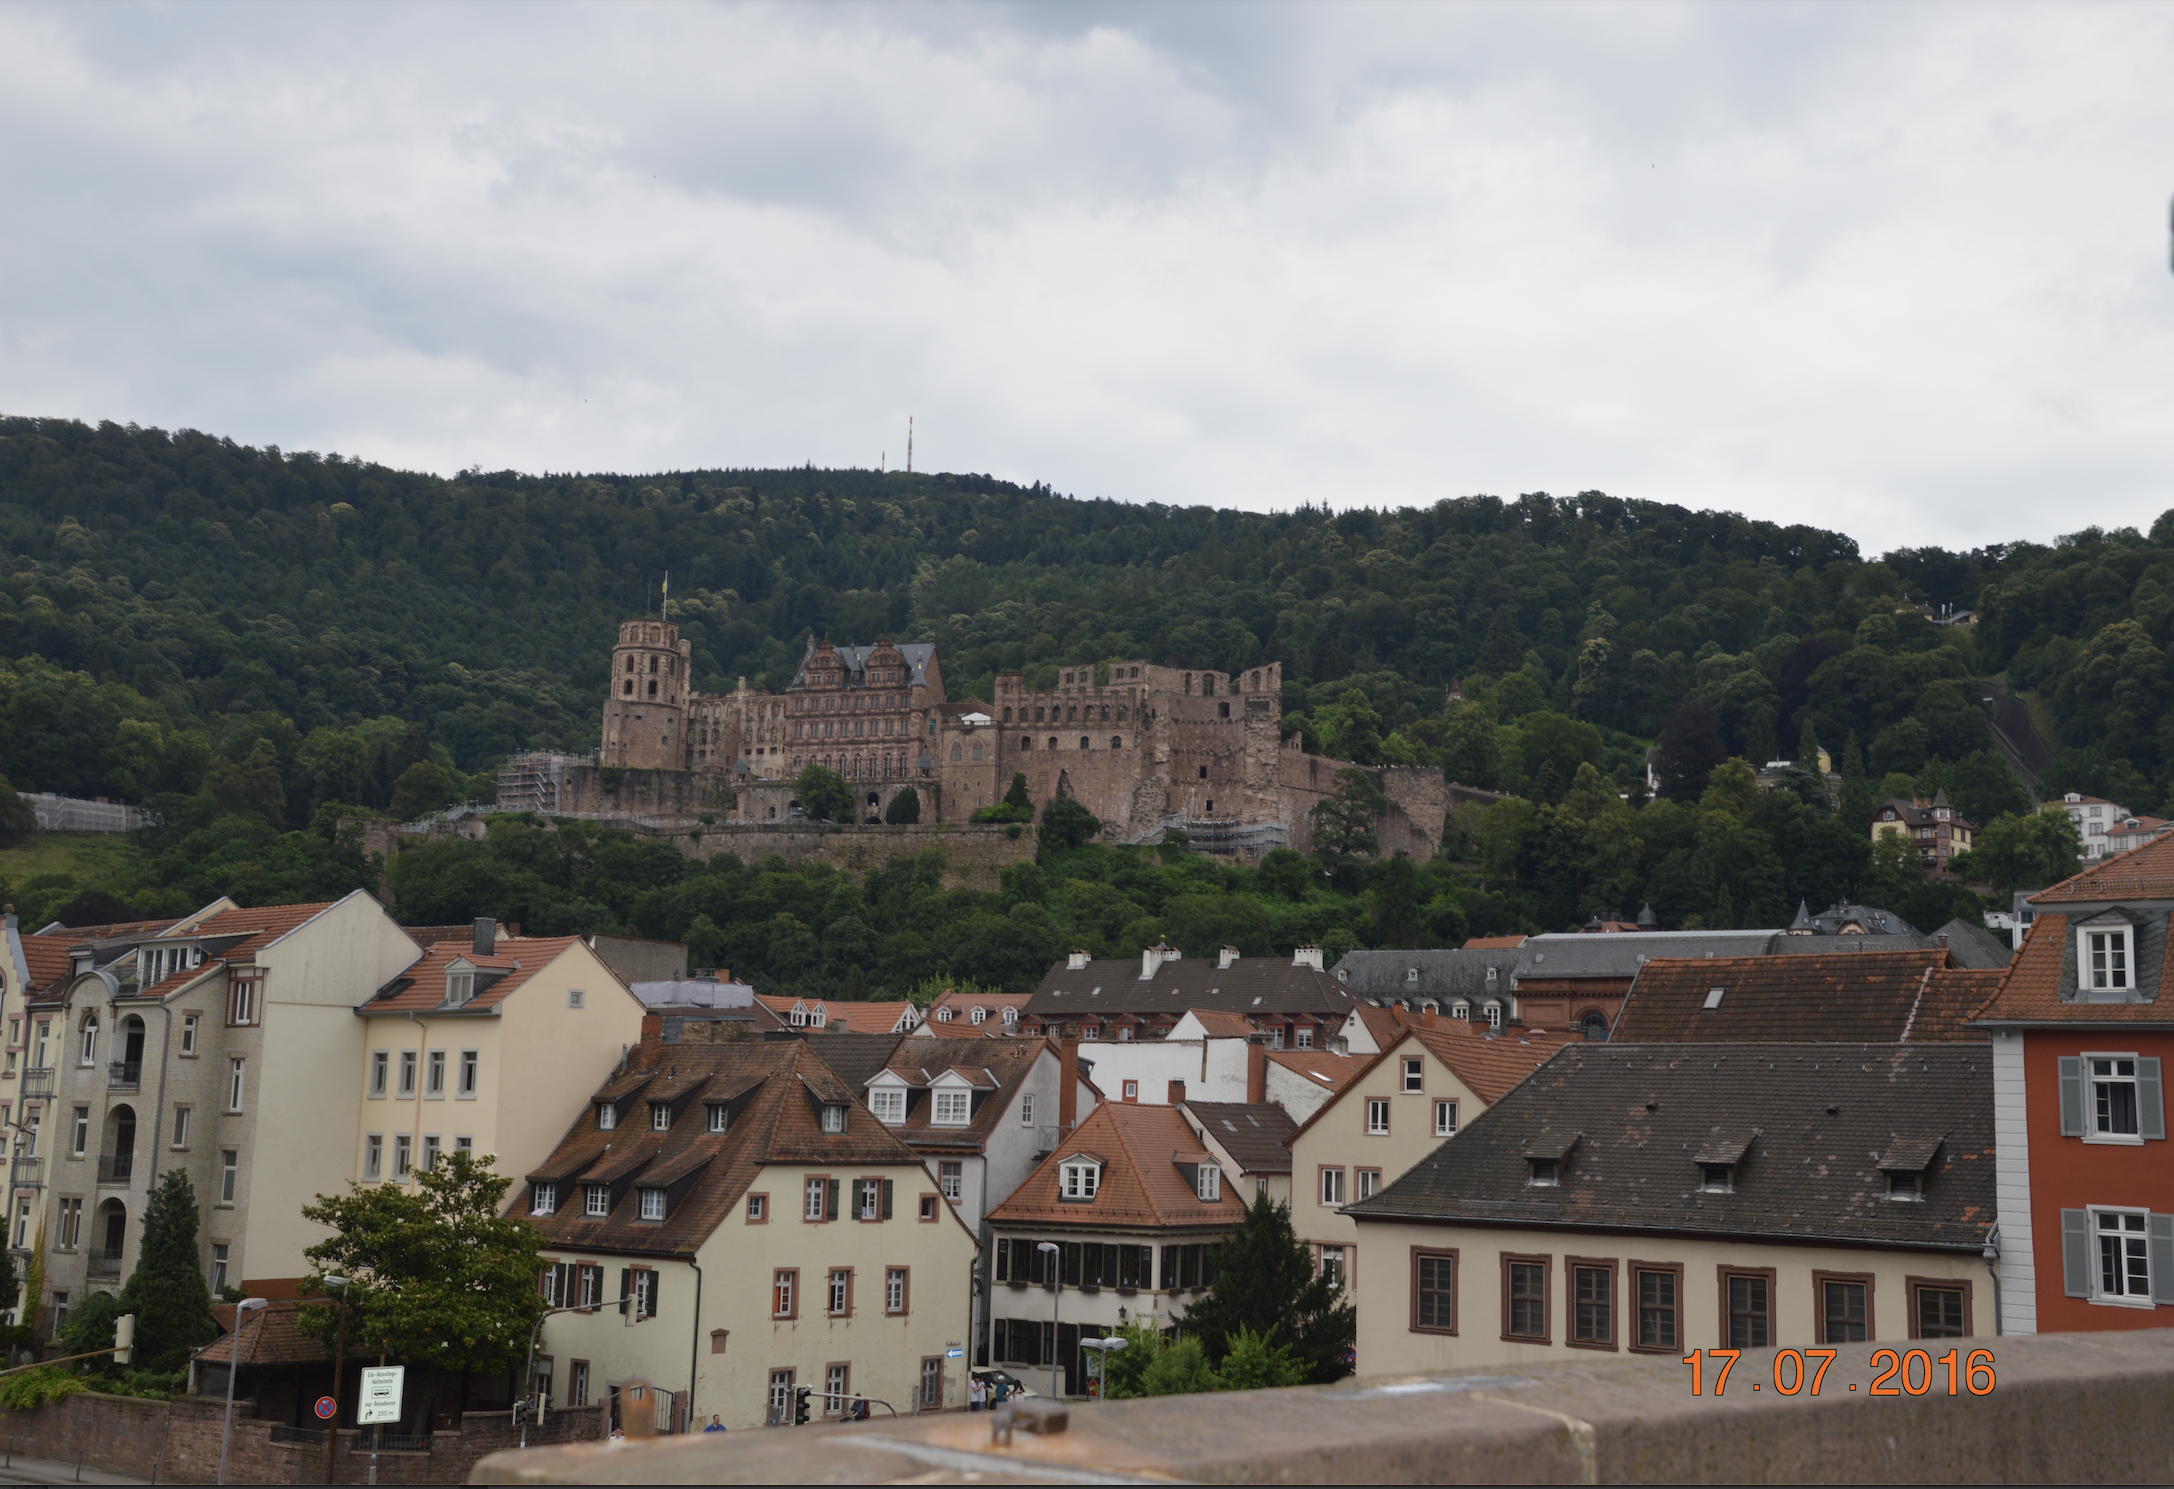
Source: Photo by Barbara Crain, CC BY 4.0
The diversity of Europe’s geography means that there are important variations not only from the Germanic cities to the cities of Mediterranean Europe but also from these areas to the eastern European cities, which are often characterized by huge, often over-sized squares in their centers. Moscow’s Red Square may serve as an example.

Source: “00 0623 Red Square in Moscow” by W. Bulach via Wikimedia Commons is licensed under CC BY-SA 4.0.

Source: “Хрущевка серии I-464А в Южном Бутово” by Seanzwiki via Wikimedia Commons is licensed under CC BY-SA 4.0.
A typical Khrushchyovka in MoscowIn addition, Russia experienced over 45 years of communism. State control of land and housing determined the development of a specific pattern of land use, expressed by huge public housing quarters and industrial zones. In some cases, the structure of the old cities has been altered, and the new urban development has extended over rural areas.

Source: “Blue Golden Green Bananas in Europe” by Luan via Wikimedia Commons is licensed under CC BY-SA 3.0.
Europe has overlapping metropolitan areas, the most extensive megalopolis, Blue Banana, also known as the Manchester-Milan Axis, being a discontinuous urban corridor in Western Europe, with a population of around 111 million inhabitants. It stretches approximately from Northwest England across Greater London to the Benelux states and along the German Rhineland, Southern Germany, Alsace in France in the west, and Switzerland to Northern Italy in the south (Figure 12.6.14). New regions that have been compared to the Blue Banana can be found on the Mediterranean coast between Valencia and Genoa, as part of the Golden Banana or European Sunbelt, and in the north of Germany, where another conurbation lies on the North Sea coast, stretching into Denmark, and from there into southern Scandinavia.
This video provides a pretty good and quick overview of the city models for the North American city and beyond. Start at 2.0 with the Burgess Model.
