
Chapter 2: Population and Health
2.3 Population Density and Pyramids
2.3.1 Measuring Populations

Source: “Sumo Crowd” by camknows via Flickr is licensed under CC BY-NC-SA 2.0
The study of human populations is known as demography. A population must be measured in order to study the characteristics of people. In other words, we need to count people and measure attributes of them to practice demography. There are two main ways of counting people. First, demographers can complete a census where every person in a geographical area is counted. Second is a sample in which a randomly selected subset of people are measured to estimate a whole population. As strange as it sounds, a census can be less accurate than a sample. As the population to measure gets larger, there are several factors that make getting an accurate census with great depth of data more difficult. When censusing a population, the number of questions must be reduced, and often the answers are simplified or multiple choice style questions, whereas samples can have longer form questions and full interviews. A census is also expensive and burdensome for data collection, whereas samples are cheaper and can be deployed more frequently, allowing change to be measured more rapidly. Lastly, a census can be less accurate because it is hard to find and count 100% of the population.
As such, often censuses will undercount. However, a well-defined sample will be able to estimate values, sometimes to a greater degree of accuracy, through statistical inference and interpolation. The US Census Bureau samples frequently. One of the most well-known is the American Community Survey which provides yearly estimates for a wide range of demographic attributes. Geographically, values estimated for larger areas, like states, will have more accuracy by having a larger sample. Smaller geographical entities, like counties, cities, and census tracts, will have more variability and sometimes need to combine 3 or 5 years worth of samples to get a solid estimate.
Exercise: Census & ACS data
If you are interested in exploring Census and ACS data, go to the United States Census Bureau website. There are guided interfaces on how to view and download data for a variety of geographical scales.
2.3.2 Density and Population Ratios
How are populations distributed spatially? It is not enough to say how many people are in a particular area, but also where do these many people reside? If two countries have the same population, but one is twice as big as the other in physical area, the populations will be distributed in different ways. For this situation, geographers use the idea of population density. Geographers divide population density into two major categories:
- Arithmetic Population density = ithe number of people in an area divided by the total land area
- Physiological Population Density = the number of people in an area divided by the amount of land under cultivation. This gives an idea of the amount of arable land being used to support a population.
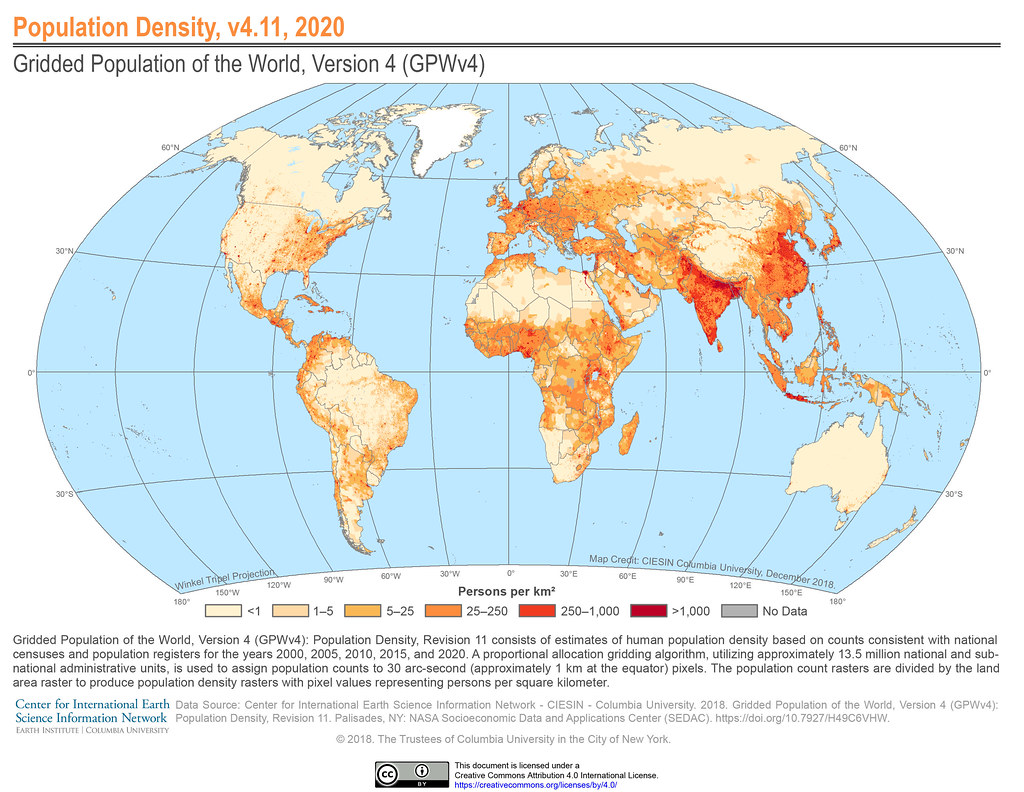
Source: “Population Density, v4.11, 2020” by SEDACMaps is licensed under CC BY 2.0
2.3.3 Population Pyramid
Beyond area-based densities, demographers will normalize the size of different subpopulations by dividing the total population into subunits; in other words, creating ratios or percentages. These can then be compared from location to location. For example, chances are that New York City, being the most populous city in the United States, will have the largest raw numbers for any particular demographic (race, age group, or multitudes of other population breakdowns). But, new patterns may emerge in seeing if these demographics are comparatively large or small as a percentage.
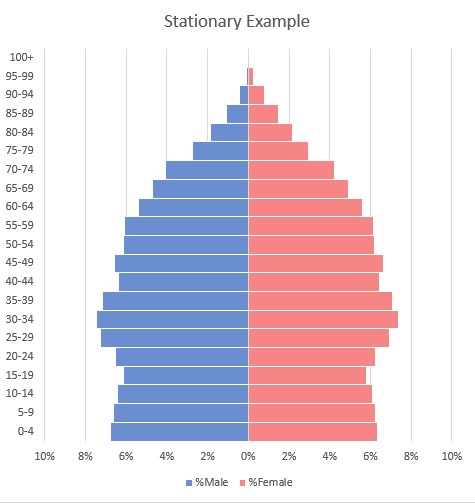
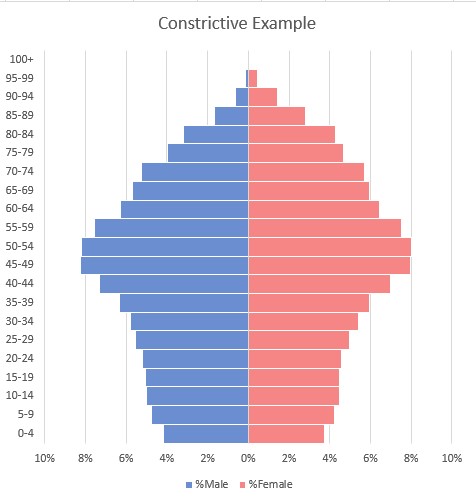
Source: “Population Pyramid Examples” by Christine Rosenfeld & Nathan Burtch is licensed under CC BY-NC-SA 4.0.
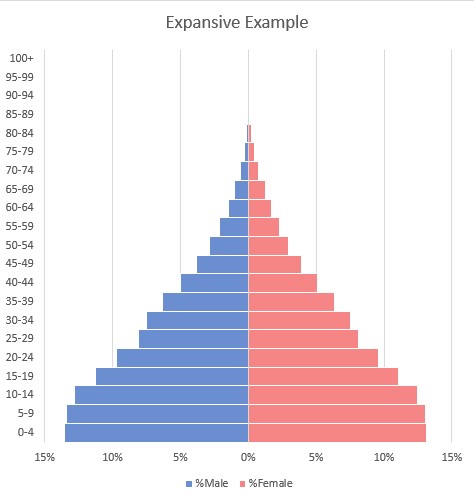
One common method of studying population is by looking at the distribution of people’s ages within a location. Visually this is done through population pyramids, which give a window into the age-based composition of a population as opposed to the geographical distribution. This horizontal bar graph separates males and females and breaks each into smaller cohorts. Cohorts are groups of people who share a common temporal experience. For example, your high school graduation year sets you in a certain cohort with others that graduate at the same time. Likewise, those that are born in the same time period form a cohort. In population pyramids, cohorts are generally grouped into 5-year intervals.
The shape of the pyramids are generally categorized as
- expansive = locations have a wide base and are experiencing high population growth;
- stationary = locations have a base close to the size of other cohorts, meaning they are either slowly growing or not growing;
- constrictive= locations have a narrow base, showing population decline.
Note that these categories are generally applied to countries; when looking at smaller geographies like cities, the same patterns don’t tend to exist. For instance, classic college towns will always have a large cohort of people from about age 20 – 30; older people move out, and younger people keep moving in, rather than a cohort aging through the location. Retirement communities will always show large cohorts of the higher age groups showing few young people.
Exercise: Explore Population Pyramids
Go to PopulationPyramid.net. There you can use the pull down menu to see current population pyramids for the world, continents, regions, or individual countries. There is also the ability to see population pyramids in the past. Look at a few; can you find:
- Examples of countries that are expansive, stationary, and constrictive?
- What continent is experiencing the fastest growth? The slowest?
- How the US population pyramid has changed over time?
Looking at borader cohorts can be illustrtive of patterns of population:
- Youth cohort: population under age 15
- Middle cohort: population between 15 and 64
- Old-age cohort: population 65 and older
The middle cohort is generally seen as the population that is economically productive. The youth and old-age cohorts are generally aged too young or too old to be a part of the labor market. These are of course quite broad comparisons and are not looking at the employment status of every single person. Looking at all cohorts one can calculate a dependency ratio by combining the youth and old-age cohorts and dividing by the size of the middle cohort. This calculates a ratio of the economically unproductive to the economically productive. Higher ratios mean that there are fewer workers supporting larger numbers of people, which can hurt economic sustainability.
Exercise: Thinking About Cohorts
Imagine that you are an urban planner, or someone working in a city government. You see the sizes of the youth, middle, and old-age cohorts. What sort of implications are there under the following scenarios? In other words, what infrastructure or policies will you explore in these situations?
- The youth cohort is relatively large
- The middle cohort is relatively large
- The old-age cohort is relatively large
Watch the TED-Ed video, Population pyramids: Powerful predictors of the future [Length 5:01].
