Chapter 11: Economy and Development
11.4 Measuring Development
Development is a broad term referring to processes of increasing the wealth and quality of life within a country.
It is common practice to conceptually break the world into different categories based on each country’s level of development. Since each country tends to have regions of differing development, these regions are often examined as well. This means that the country’s development level will display the average of its development; there may be pockets of very high development and pockets of poverty. The result is a geography of development that codes regions like North America and Europe as developed and regions like South Asia and East Asia as less developed. But what does this actually mean?
Over the years different terms were used to describe the various developments; however, most are unsatisfactory. Take the term ‘third world country’. If you were to live in such a country, you might be insulted and also puzzled. Because, nowadays it is not clear what a ‘third world country’ actually is. What would be the first world country? What would be the second world country? In short, this term is a leftover from the Cold War where Russia and its allies were deemed to be ‘second world countries’, the Western allies were all ‘first world countries’ and the rest of the world was ‘third world’. Quite an inaccurate term!

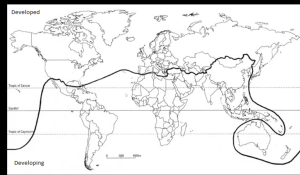
Source: “The Brandt Line” by Jovan.gec via Wikimedia Commons is licensed under CC BY-SA 4.0.
The Brandt line, division of world on rich north and poor south.Willy Brand, the former German chancellor, created the Brandt line based on GDP per capita, basically a visual depiction of the North-South divide between their economies. The world is thus divided into the Global North and the Global South by the Brandt Line (see Figure 11. 1). The line is problematic because it over-generalizes.

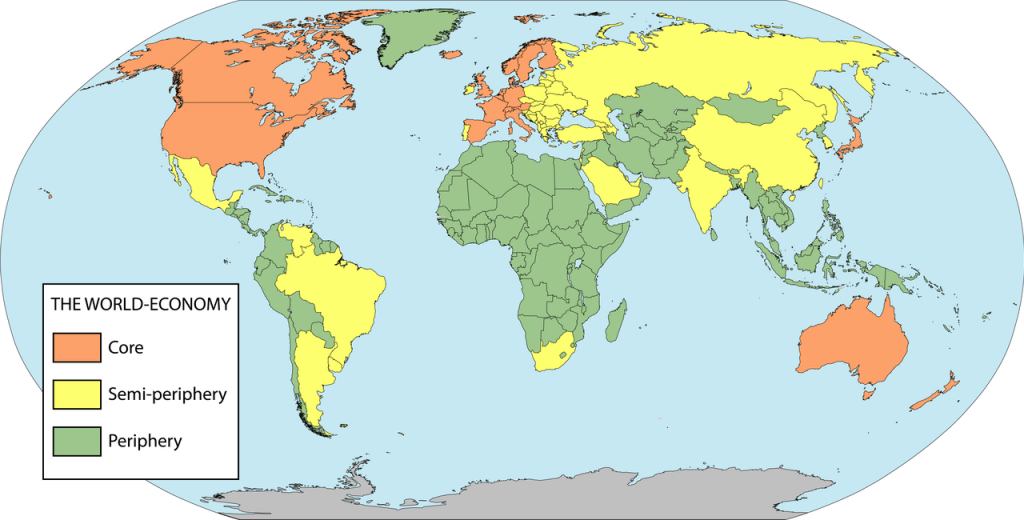
Source: “Wallerstein’s Core-periphery model” by Mirkyton via Wikimedia Commons is licensed under CC0 1.0.
Geographers came up with what was thought to be less weighted terminology referring to more developed countries as MDCs and to less/least developed country. as LDCs. This divided the world into only two categories which is quite misleading as well. Other terms used to describe these distinctions divided the world back up into three categories such as core, periphery and semi-periphery regions which were foregrounded as part of sociologist and historian Immanual Wallerstein ‘world systems theory‘.

Source: “The World Economy. Wallerstein. World-systems analysis” by Vladusty via Wikimedia Commons is licensed under CC0 1.0.
So, how do we assess and measure development? It is best to follow the United Nations’ (UN) lead and categorize the world’s countries according to their income: high income, upper middle income, lower middle income, low income. Using this categorization we will find that most of the world’s countries are defined middle income, not low or lower income. This should change our perception of the world a bit.
Click on the map to goggle between countries and for better visibility of the data.
Common metrics include the following:
- HDI, Human Development Index (= a summary measure of average achievement in key dimensions of human development: a long and healthy life, being knowledgeable and having a decent standard of living)
- GII*, Gender Inequality Index (= reproductive health, empowerment and the labour market. A low GII value indicates low inequality between women and men, and vice-versa.)
- GDP, Gross Domestic Product (=value added created through the production of goods and services in a country during a certain period.)
- GNI per capita, Gross National Income per person( = the dollar value of a country’s final income in a year, divided by its population. It should be reflecting the average before tax income of a country’s citizens.)
- Gini coefficient, which measures income inequality (= household disposable income in a particular year. The range is between 0 in the case of perfect equality and 1 in the case of perfect inequality)

