Chapter 7: Race and Ethnicity
7.6 Distribution of US Ethnicities
The distribution of ethnicities in the United States follows patterns that have been in place for some time. Historic migrations, some of which were forced, produced the patterns we still see in the United States.
7.6.1 African Americans in the United States
African Americans in the United States are still heavily southern. Their distribution as you can see in Figure 7.3.1dates to the beginning of the United States and the forced importation of millions of Africans. Starting in the early twentieth century, many African Americans migrated out of the American South, which was the beginning of the Great Migration.
This was one of the largest movements in U.S. history, with about six million African Americans relocating from the South to Northern, Midwestern, and Western states from the 1910s to the 1970s. They sought to escape racial violence, and oppression, and to pursue better economic and educational opportunities.
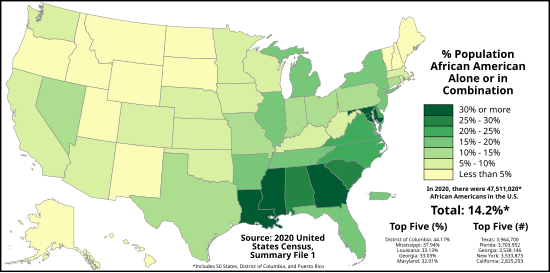
Source: “Proportion of African Americans in each U.S. state, Washington, D.C., and Puerto Rico as of the 2020 United States Census” by Abbasi786786 via Wikimedia Commons is licensed under CC BY-SA 4.0
7.6.2 Hispanic Americans in the United States
Many of the states with large Hispanic populations were states taken from Mexico by the United States in the Mexican-American War. In some ways, these places didn’t come to the United States; the United States came to them. Certainly, a pattern is apparent. Generally, the parts of the U.S. closest to Mexico or the Caribbean are the most Hispanic (Figure 7.4). There are other areas with high Hispanic populations. These places have been attractive to immigrants for their employment prospects.
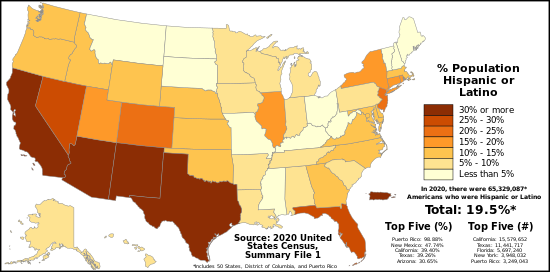
Source: “Proportion of Americans who are Hispanic in each US state, the District of Columbia, and Puerto Rico as of the 2020 United States Census” by Abbasi786786 via Wikimedia Commons is licensed under CC BY-SA 4.0.
7.6.3 Asian Americans in the United States
The 2020 United States Census reported approximately 19.9 million people identified as Asian alone in 2020. Adding in the 4.1 million respondents who identified as Asian in combination with another race group, the Asian American population comprised 24 million people (7.2% of the total population. he overall population is highly urbanized and is concentrated in the West Coast of the United States and New York metropolitan area.
The western United States and, in particular, Hawaii are physically the parts of the United States that are closest to Asia. A proximity effect similar to that of Hispanics is in play here. Figure 7.3.4 shows their distribution.
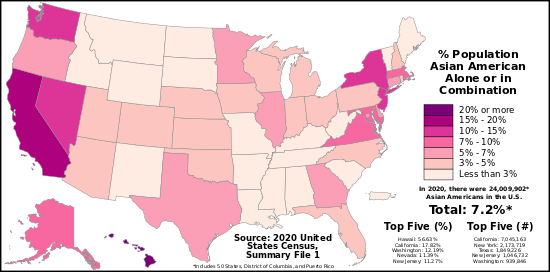
Source: “Proportion of Asian Americans in each U.S. state, the District of Columbia, and Puerto Rico as of the 2020 United States Census” by Abbasi786786 via Wikimedia Commons is licensed under CC BY-SA 4.0.
7.6.4 Native Americans in the United States
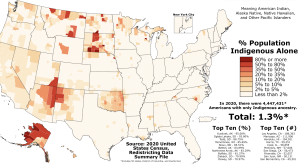
Source: “Proportion of Indigenous Americans (Including Native Hawaiians) in each county” by Abbasi786786 via Wikimedia Commons is licensed under CC BY-SA 4.0.
The descendants of Indigenous peoples are classified by the American government into three major groups: Native American, Alaska Native and Native Hawaiian. Native Americans are clustered in the southwest and north-central regions of the US. In some states Native Americans exceed 10% of the population (e.g. Oklahoma, Alaska, New Mexico, South Dakota). Most do not live on reservations.
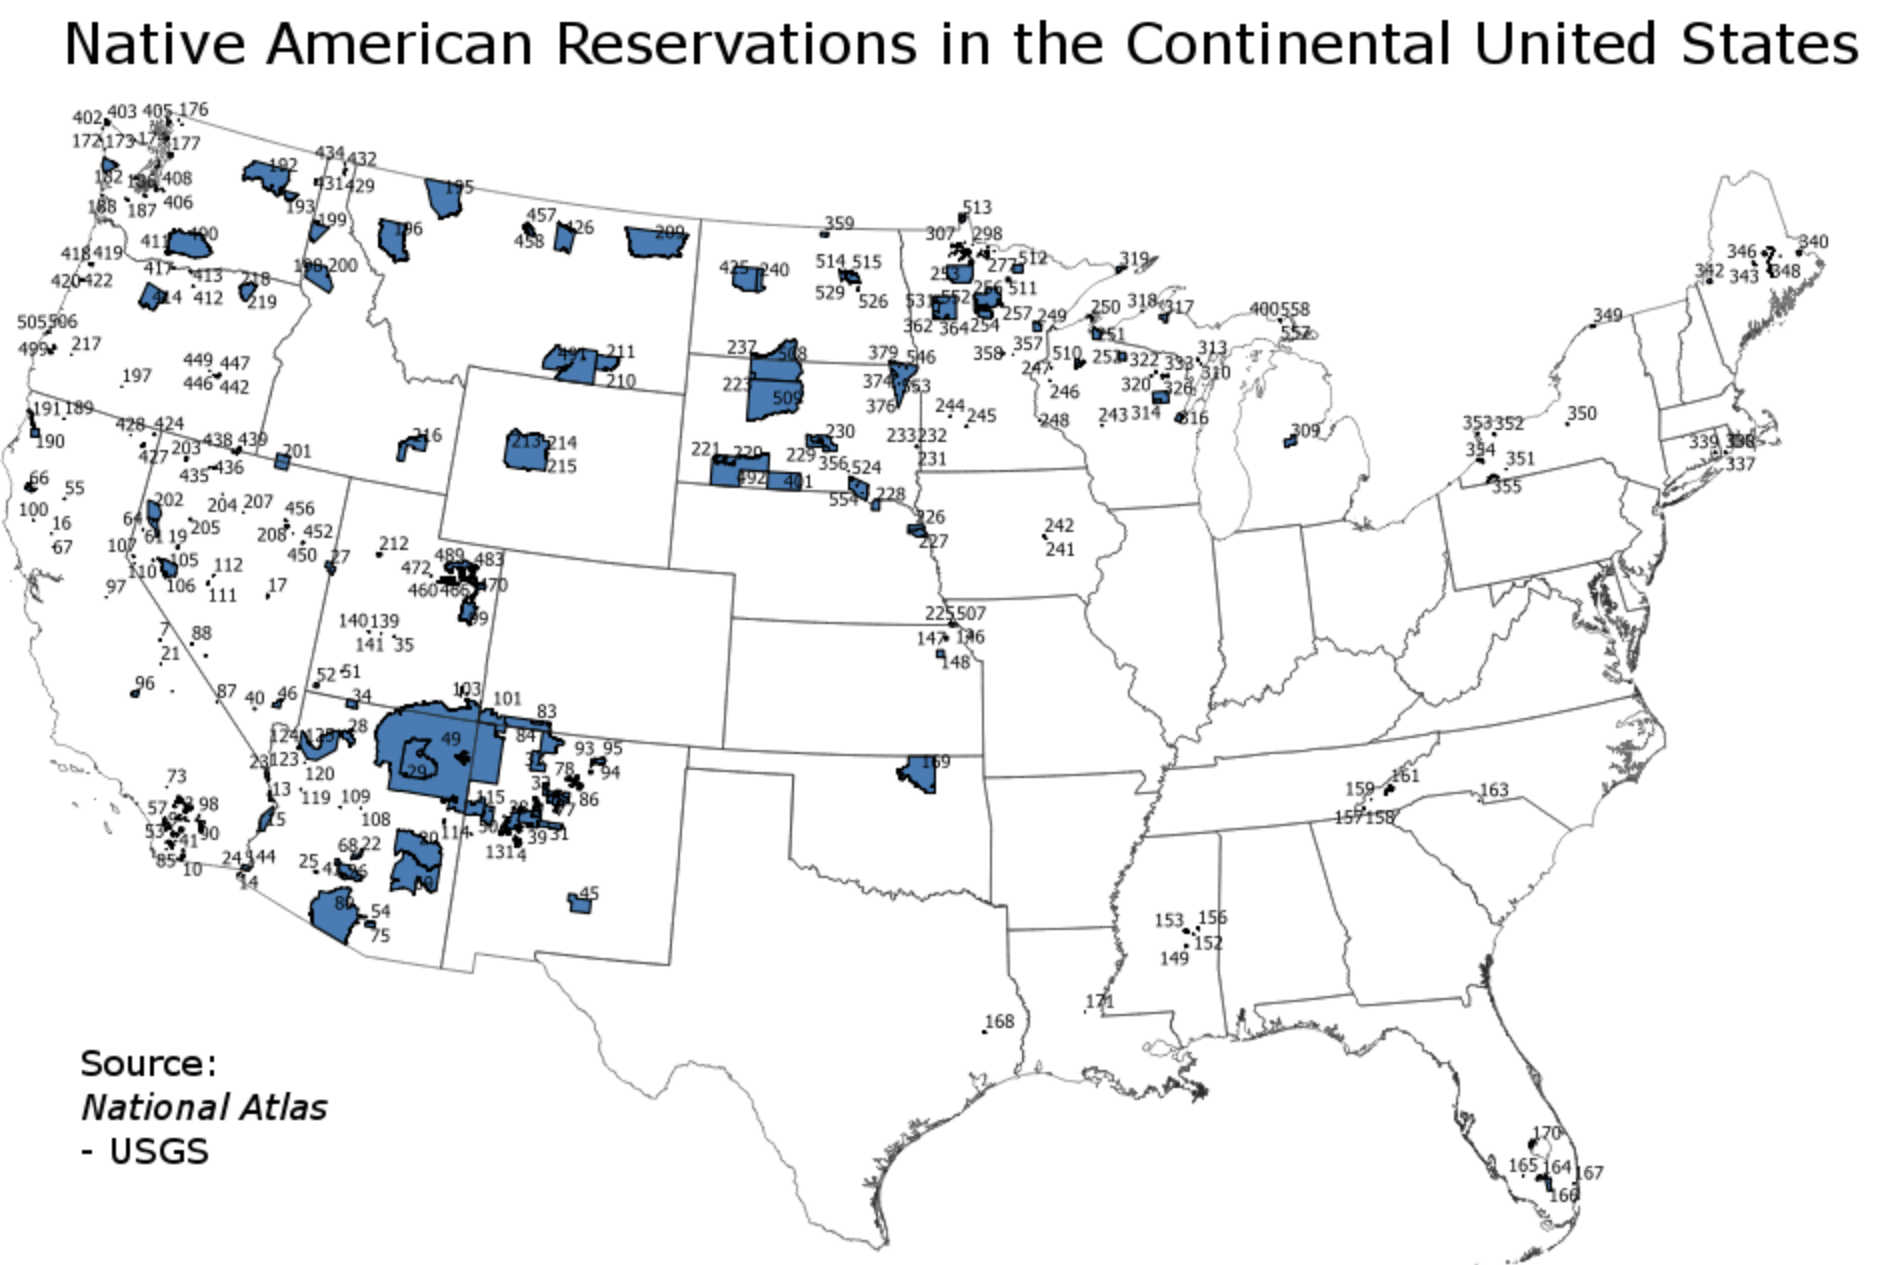
Source: “Map of Native American reservations in the Continental United States.” by Presidentman via Wikimedia Commons is licensed under CC BY-SA 4.0.

