Chapter 2: Population and Health
2.4 Population Change
2.4.1 Birth and Death Rates, Fertility Rates
Populations change can be described with a fairly simple equation:
Population Change = Previous Population + Births – Deaths + Immigration – Emigration
Natural changes to the population occur via births and deaths. While total numbers of births and deaths are what will change the population, demographers often look at crude birth rates (CBR). These are the total number of births in a given time period per 1,000 people in a population. The crude death rate (CDR) is the same but for deaths.
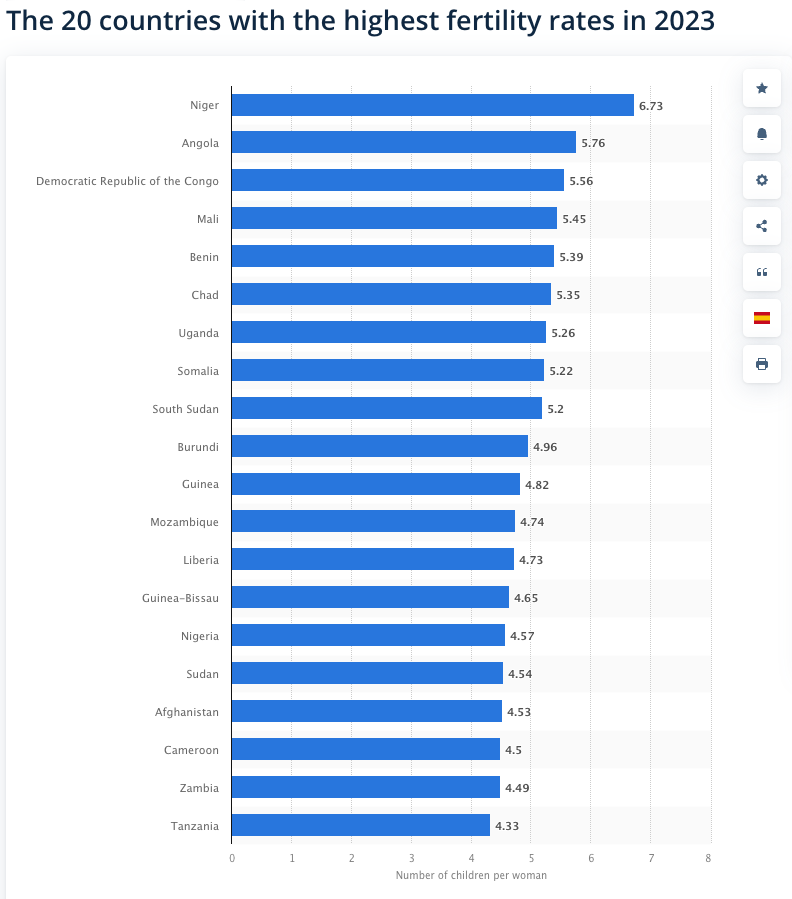
Source: “The 20 countries with the highest fertility rates in 2023” published by Aaron O’Neill on May 22, 2024 via Statista.com – Most countries are located in Africa.
A narrower slice at looking at natural increases is to understand the total fertility rate(TFR). This is the average number of children born by females aged 15-49, which is the age range typically tied to reproduction. Demographers look at a TFR of 2.1; if TFR falls below this number, there will be a natural decline in population as not enough births are happening for replacement rate. According to the CIA World Factbook the country with the highest total fertility rate is Niger at 6.64. The United States has the 143rd highest value at 1.87. The world is listed at 2.24 meaning the world population is still increasing.
2.4.2 Global Population Trends
A region’s population will grow as long as their crude birth rates (CBR) are higher than their crude death rates (CDR). Thus, a crude birth rate of 10 would mean ten babies are born every year for every 1,000 people in that region.
When comparing CBRs to CDRs, a region’s natural increase rate can be determined. A natural increase rate (NIR) is the percent a population will grow per year, excluding annual migration. Usually, an NIR of 2.1 is required to maintain or stabilize a region’s population. Any more than that and the population will grow, any less than a NIR of 2.1 causes population contraction. The reason why the NIR percent is 2.1 and not 2.0 for stability is because not every human will pair up and have a child because of genetics, choice, or death before childbearing years. Once we know the NIR, we can determine the doubling time. Doubling time is how many years it would take for a defined population to double in size, assuming that NIR stays the same over time. Currently, about 82 million people are added to the world’s global population every year.
Key Factors Influencing Population Change
Three key factors to understand when trying to predict or analyze population change are the
- total fertility rate (TFR)– is the average number of children a woman would be expected to have during childbearing years (between 15-49 years old)
- under-five-mortality rate –
- life expectancy at birth.
Total fertility rate: The global average for TFRs is about 2.24, but in less developed countries, it is as high as 5.0 or higher, and in more developed countries, it is as low as 2.0 or less. Fertility patterns can vary widely within countries. Racial and ethnic minorities may have higher fertility rates than the majority, and families with low incomes or low levels of education typically have more children than those that are affluent or well-educated. Women who work outside the home typically have fewer children than those who stay home, and rural families tend to have more children than city dwellers.
In 2023, in the United States , the general fertility rate was 54.4 births per 1,000 females ages 15–44, down 3% from 2022. The total fertility rate was 1,616.5 births per 1,000 women in 2023, a decline of 2% from 2022. According to the Population Reference Bureau, the number of births per 1,000 people worldwide was 17 with extremes ranging from a low of 9 (mainly in Northern and Western Europe and Hong Kong), to 11 for the United States to 45 or less in a few West African nations (Population Reference Bureau, 2016 World Population Data Sheet, pp. 10-19).
Mortality is the second significant variable that shapes population trends. A population’s age structure is an essential factor influencing its death rate. Death rates are highest among infants, young children, and the elderly, so societies with many older adults are likely to have more deaths per 1,000 people than those where most citizens are young adults. Higher income countries with excellent medical services have more people in older age brackets than countries with lower incomes, so the societies with higher incomes can have higher death rates even though they are healthier places to live overall.
An important measure is the the under-five mortality rate (U5MR) is the number of deaths of infants and children under five years old per 1000 live birth annually. The highest U5MR are in lower income, often tropical countries where rates can be as high as 50 or more (the highest I saw was 114 for Somalia and Nigeria). Conversely, in a place like Europe, it is as low as 5 to 2.1 for Estonia and 2.2 for Norway.

Source: “Infant (under five) Mortality Rate per 1,000 Live Births, Map of the World 2019” by Altes via Wikimedia Commons is licensed under CC BY-SA 4.0.
Life expectancy at birth is straightforward—it is an average of how many years a newborn is expected to live, assuming that mortality rates stay consistent. In many higher income countries, the average life expectancy is over 80 years old (in the United States it is 77) and in countries with less income, it is only around 50 years (Figure 2.4.3).
When we compare CBRs, CDRs, and TFRs, we find that the world has a large population of youth with the most substantial percent in lower income countries. This causes high stress on the education systems and, to some extent, the health care systems in poorer countries. However, higher income countries tend to have older demographics, which tends to cause stress on the health care and social safety nets of those countries. The dependency ratio discussed earlier in this chapter, is used to understand these stresses as it combines the number of people who are too young or too old to work and compares it to the number of people who are in their “productive years.” The larger the ratio, the greater the economic stress on those nations.
2.4.3 Population Changes in the Most Populated Countries
EXAMPLE: India

Source: “Fertility Rates Across India” by iashris.com via Wikimedia Commons is licensed under CC BY-SA 4.0.
Since 1952 India has implemented various family planning policies and programs over the years to address population growth and promote reproductive health with variable success. It was one of the first countries to launch the National Family Planning Program in 1952, aiming to provide family planning services, including contraception, maternal health care, and reproductive education, to couples across India. It initially focused on promoting sterilization as a primary method of contraception but met with resistance so it later expanded to include a wider range of contraceptive options.
In general, the government held Educational Campaigns primarily in rural areas raising awareness about family planning, reproductive health, and the benefits of small family sizes. These campaigns target both men and women and emphasize the importance of informed decision-making regarding family size and contraceptive use.
It can be deceptive, however, to view India as an undivided whole. As shown on the map (Figure 2.4.4), fertility figures for most of India are actually below replacement level. Were it not for the densely populated and impoverished northern areas India would have looked at population stabilization and even decline much earlier. All the states of southern and central and northern India displayTFR figures below 2.
Reasons for the population decline might be:
- better education for females since this allows females to pursue jobs and have less time for children;
- better economic conditions;
- increased urbanization and rapid growth of India’s cities (but India is still quite a rural society);
- social indicators such as higher life expectancies;
- cultural change as triggered by soap operas on TV where families with two children appear as the norm.
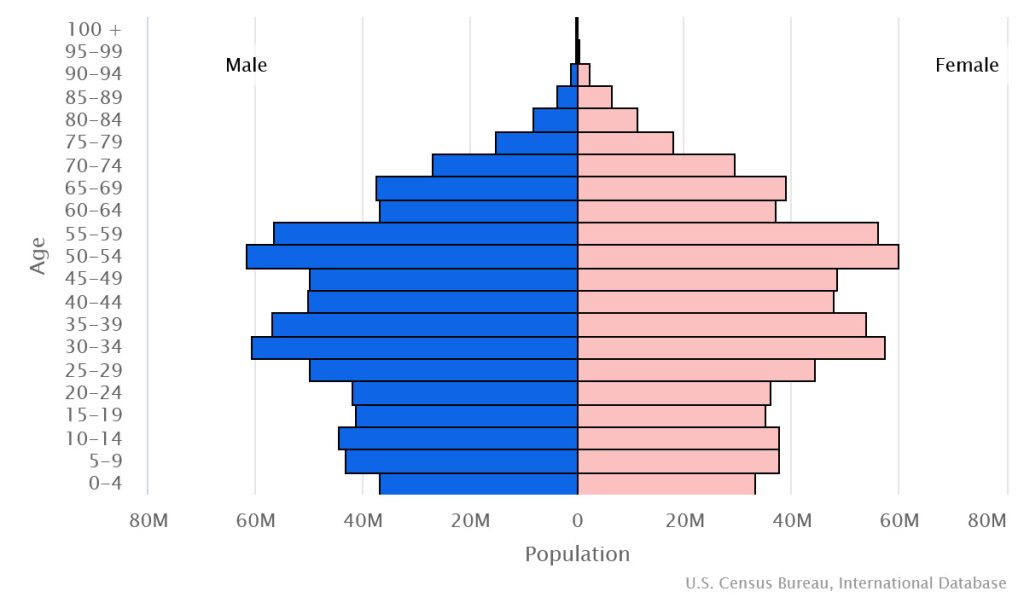
Source: “Population Pyramid India” retrieved from CIA World Factbook – India
As a result India indeed entered replacement level a few years ago despite having produced enough growth to claim the title of ‘most populated country’ in the world toppling China from that position.