
Chapter 14: The Humanized Environment
14.3 Natural Resources and Human Impact

Source: “Bingham Canyon April 2005” by Tim Jarrett via Wikimedia Commons is licensed under CC BY-SA 3.0.
14.3.1 Use of Non-renewable and Renewable Resources
If you look really closely, you can see tiny trucks in this photo — except the trucks aren’t tiny at all. In fact, they are huge vehicles, with tires taller than most adults. The trucks only appear to be tiny because of the huge hole they are in. That hole is the largest human-made excavation in the world, and it may be the only human-made feature on Earth that is visible to the naked eye from an orbiting satellite. What is this giant hole in the ground? It is an open-pit copper mine called the Bingham Canyon Mine. Besides copper, it also produces gold, silver, and molybdenum. Located near Salt Lake City, Utah, the mine has been in operation since 1906, resulting over time in the creation of a pit more than half a mile deep and 2.5 miles wide. It resembles a huge stadium with its terraced sides, and if it really were a stadium, it could seat nine million people. Remarkably, the huge pit was once a mountain.
Extracting copper from under the ground by digging a huge hole where a mountain once stood is expensive, but it’s obviously worth it. The value of the copper and other minerals extracted from the Bingham Canyon Mine has been estimated to be greater than the value of minerals from the Comstock Lode, Klondike, and California gold rush mining regions combined. In just one year (2006), the value of metals removed from the Bingham Canyon Mine was almost $2 billion. The wealth of minerals removed from the mine has earned it the moniker “the richest hole on Earth.” Copper is valuable because its properties make it extremely useful for many purposes. It is used for roofing and other building materials, electric wires and cables, and water pipes and fittings. Copper is even used to make computers and clothing. Minerals such as copper are just one type of natural resources.
Resources refer to substances that have utility for humans in some way. They include sun, wind, water, trees and vegetation, land, soil, minerals, and oil and gas, among other things. Resources are renewable if they can replenish and non-renewable if there is a finite amount of them. It can be helpful to examine land cover and land use types to gain insight into the presence of various resources and how they are used by humans. See the maps below for a look into how oil reserves and land cover types in terms of level of human modification are distributed globally.
---2017---US-EIA---Jo-Di-graphics.jpg)
Source: “Map-of-countries-by-proven-oil-reserves-(in-millions-of-barrels)—2017—US-EIA—Jo-Di-graphics” by Jo Di Graphics via Wikimedia Commons is licensed under CC BY-SA 4.0.
14.3.2 The Changing Land Use and Land Cover
As the global population grows, the strain on land resources intensifies. Forests are cleared, grasses burned for agriculture, mountains flattened for transportation and mining, and cities expand into productive farmland. Land use describes how people utilize land resources for specific purposes, such as agriculture. In contrast, land cover refers to the physical material present on the ground, like grasses, trees, or pavement (Coffey 2013).
Over time, changes in land use directly affect land cover. For example, deforesting an area to plant crops changes the land use from forest to agriculture and simultaneously alters the land cover from trees to row crops affecting wildlife and flora.
The map below looks at how humans have changed the land use and land cover using 13 anthropogenic stressors including 1) human settlement (population density, built-up areas), 2) agriculture (cropland, livestock), 3) transportation (major roads, minor roads, two-tracks, and railroads), 4) mining and energy production (mining/industrial areas, oil wells and wind turbines), and 5) electrical infrastructure (powerlines and night-time lights).and their estimated impacts using spatially-explicit global data sets. Much of the inhabited world sees human modification and stresses, notably in East Asia, much of India, Europe and Sub-Saharan Africa.
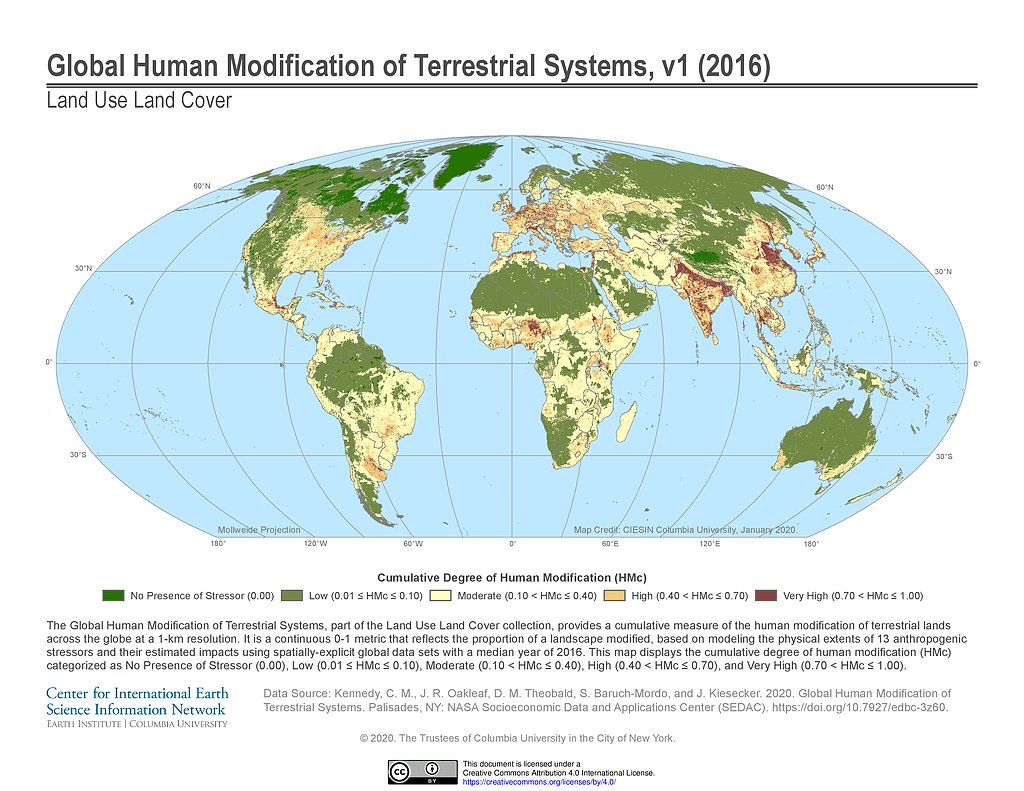
Source: “Global Human Modification of Terrestrial Systems, v1 (2016) – Land Use Land Cover” by Center for International Earth Science Information Network | EARTH INSTITUTE I GOTTSMA UNIVERSIT is licensed under CC BY 4.0.
14.3.3 Fresh Water Scarcity
Water, essential for life, is a renewable resource. The global volume of precipitation is vast; if evenly distributed, it would cover Earth’s land area with approximately 33 inches (83 cm) of water annually. However, freshwater availability is unevenly distributed worldwide. Figure 14.3.4 illustrates global precipitation patterns, with the highest amounts along the equator and in the tropics. Despite the abundance of water on Earth, freshwater is not plentiful everywhere, leading to chronic shortages in both rural and urban areas.
All one needs to do is study rainfall maps to appreciate how uneven the distribution of water really is. The white areas on the map below had annual rainfall under 400 mm for the last year, which makes them semi-arid or arid. And, remember, projections are for significant aridification to occur in many dry regions and for more severe rainfall events to characterize wet regions.
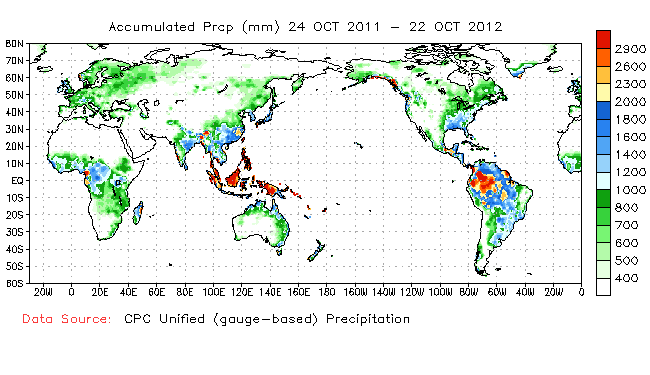
Source: “Accumulated Precipitation” by Drs. Timothy Bralower and David Bice, Professors of Geosciences, College of Earth and Mineral Science, The Pennsylvania State University is licensed under CC BY-NC-SA 4.0. Data Source: CPC Unified.
Check the video for an illustration of the hydrological cycle showing that the cycle is finite. Water that is allowed to trickle down the soil into rock will have good chances of getting purified as much of our global water is quite polluted. This means it is in our interest to have as much natural land cover as possible.
The availability of fresh water is undergoing rapid changes worldwide, highlighting a precarious future that demands attention from both policymakers and the public. Water security, which refers to ensuring access to sufficient quantities of safe water for daily needs, faces greater risks than commonly recognized. Distinct global patterns are emerging that categorize regions into water “haves” and “have-nots.”
For instance, high-latitude regions such as the northern United States and tropical areas globally are experiencing increased precipitation. In contrast, mid-latitude regions—typically arid to semi-arid zones—are becoming drier. This phenomenon of wet regions getting wetter and dry regions getting drier aligns with longstanding predictions from Intergovernmental Panel on Climate Change (IPCC) reports. However, a recent IPCC study, along with earlier findings from the team, confirms that these changes are currently underway, rather than merely projected for the end of the 21st century as per IPCC forecasts.
Climate change is altering extremes in flooding and drought worldwide. The PewTrust research map (see Figure 14.3.4 below) shows the most severe shifts and quantifies their accelerating rates. Major flooding has intensified notably in regions like the U.S. Upper Midwest and southern Alberta, Canada (notably in 2011 and 2005-2013); the Amazon and Orinoco River basins in South America; and southern Africa’s Okavango Delta.
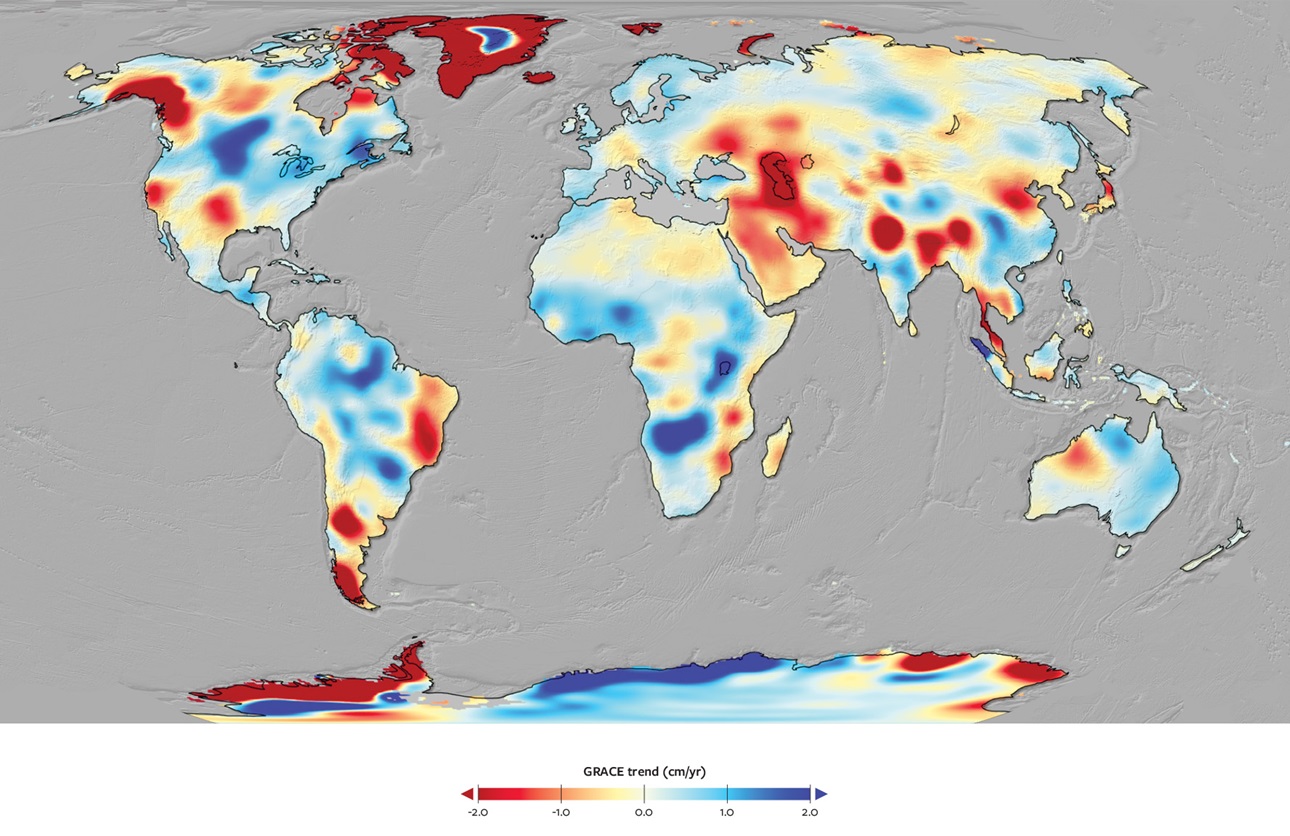
Source: “A Map of the Future of Water” by Jay Famiglietti via The Pew Charitable Trusts. All Rights Reserved.
The map also highlights hot spots where drought extremes have dramatically worsened. These include California and Texas during various drought periods (2005-06, 2007-08, 2010-15 for Texas; 2006-10, 2011-15 for California), as well as southeastern Brazil’s severe drought from 2014 to 2017, nearly causing water shortages in Sao Paulo, a city of over 12 million. Eastern Europe faces chronic droughts, and the Caspian-Aral Sea region in Asia is experiencing long-term drying of the once-vast inland sea.
As climate change continues, these areas and potentially others may see increasing hardships, damages, and risks to life from intensified flooding and drought, potentially making these extremes the new normal.
14.3.4 Measuring Human Impact
Human impact to the environment is unevenly distributed across the world and often results in depleting resources in an unsustainable way (example: over fishing to the point that the fish cannot replenish) and prompting or amplifying environmental hazards (example: making previously arable land unsuitable for agriculture). One way we can measure or assess that impact is by relying on the IPAT framework, which holds that the degree of environmental impact is a mixture of how many people are in a place, how they use resources, and how affluent they are.
If two countries have the same population and access to/use of the same types of technology, the more affluent country will have a higher impact. Why? Because generally more affluent lifestyles take more energy and use of resources to support. If, however, two countries have about the same level of affluence and the same number of people, the country with the least efficient technology will have a higher impact; this is why sometimes non-core countries actually have high overall impact.
Impact = Population x Affluence x Technology
One common method to assess an individual’s environmental impact is to calculate their ecological footprint (Wackernagel and Rees, 1996). This measure estimates the amount of resources, waste sinks, and services needed to sustain a person’s lifestyle. Ecological footprints are often calculated for specific resources or sinks, such as a “carbon footprint” for CO2 emissions, or converted into a common metric of land area. For example, it might be said, “we would need four Earths if everyone lived like you.” Although there is ongoing debate about the precise calculations of ecological footprints, the concept remains crucial for understanding environmental impact.
The size of an individual’s ecological footprint is influenced by both personal habits and the social structure they live in. For instance, footprint analyses have shown that even Buddhist monks in the U.S., who live frugally, have higher ecological footprints than the average person in some less-developed countries (MIT, 2008). This is because the economic system and infrastructure in the U.S. make it challenging to meet daily needs without significant environmental impact. Conversely, the monks still have a much smaller footprint compared to a businessperson who consumes more resources, such as eating steak daily and taking frequent flights.
The physical location of the activities included in a person’s ecological footprint may be dispersed around the world. Indeed, in many cases the environments of countries in the global economic core have been cleaned up by simply displacing dirty industries and dangerous wastes to the periphery. This means that the impacts of a person’s footprint may be borne by other people. Understanding which people will bear which impacts depends on the nature of the resource or sink in question, the power differences between people along various ranges rof inequality, and the structure of the national and international economies. Click on the map below to enter the website of the Global Footprint Network organization that helps you understand where which country stands in terms of natural resource use.
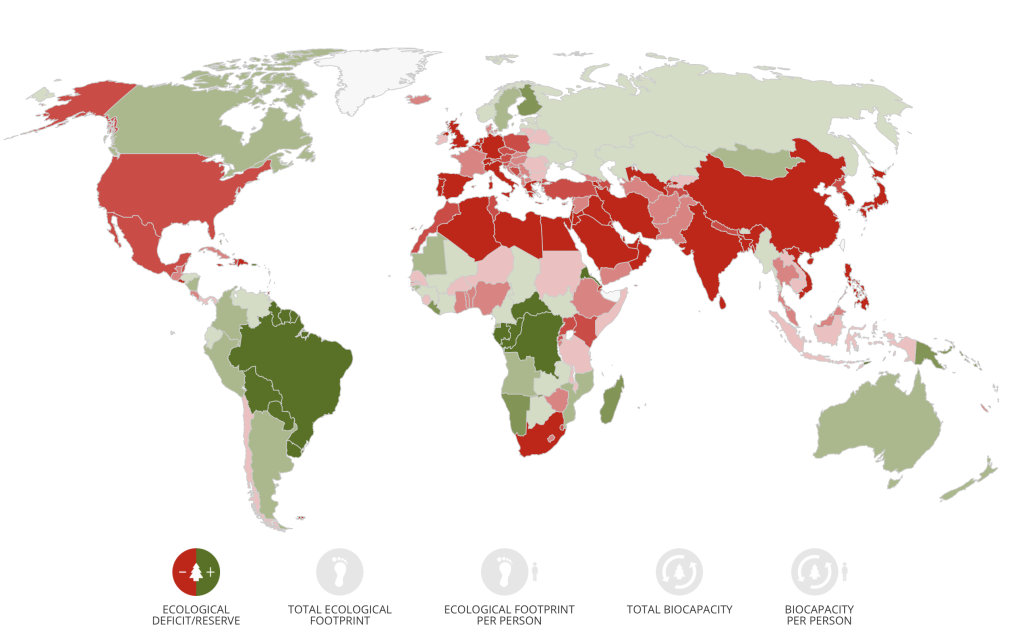
Source: a Screenshot of the Global Footprint Network: Advancing the Science of Sustainability website.
Researchers who examine human impact to the environment have noted that the extent and depth of impact nowadays is so great, that humans are the greatest source of impact to the environment. Geologists call this time period the anthropocene, which is different than past geologic time periods regarding the scale of human impact. If you’re interested to learn more, skim this article, Where in the World Is the Anthropocene? by Hannah Waters and see the embedded interactive graphic.
14.3.5 Forms of Human Impact
Humans have the capacity to modify the landscape in ways and at rates never before seen. Let’s look at a few examples of this and think through related socio-cultural issues that arise with this level of human impact.

Source: “Amazon fire satellite image” by NASA Earth Observatory images by Joshua Stevens via Wikimedia Commons is in the public domain in the United States.
Deforestation, which refers to the clearing of trees, is one of the principal processes involved in converting or modifying landcover. Why does deforestation happen? It happens to make way for some new kind of land use, most typically, some kind of agriculture (cattle ranching and soya cultivation primarily) or infrastructural development. A common way to clear forests is by setting fires; the Amazon experienced uncontrolled burning in 2019. Remote sensing is often used to capture information about landscape change. See below for a breakdown of what’s going on in the Amazon in Latin America.
Desertification refers to the extension of desert-like conditions into otherwise non-desert land. Causes include deforestation, drought, and sustained overuse/improper land use in some way. Greening, or adding vegetation to restore areas to mitigate the effects, is sometimes used to combat desertification. Learn about both of these processes by reading and exploring this fantastic story map showcasing China’s efforts at greening large swaths of land which straddles China and Mongolia.
Processes of the extractive industries such as mining of metals, minerals, oil, and gas. result in heavy human impact to the environment. See below for real-world examples.
Examples of Extractive Activities
Read up on the following examples and ask yourself: What are the socio-cultural impacts of these activities? Can diamonds be conflict-free? Who is effected most by diamond mining and fracking? What can be done to minimize impact for each activity?
- Diamond mining occurs in large parts throughout South, Central, and West Africa but also in countries like Canada, Russia, China, Brazil, and Australia. Diamonds coming from African countries have classically been termed blood diamonds or conflict diamonds, reflecting the fact that these diamonds were/are produced by workers during wartime under duress, force, and violence. Many diamonds today are sold under the label conflict-free. Brands such as Brilliant Earth, among others, market their products accordingly.
- Fracking, which refers to hydraulic fracturing or injecting water into underground rock layers to crack them and release natural gas, used for energy. Companies tend to go into towns, set up operations, and then leave when all the gas is extracted, which mimics a boom-and-bust economic cycle, as happened in Williston, North Dakota. Apart from causing visual blight by leaving behind concrete platforms that were needed for the heavy equipment, fracking causes quite some environmental damage by causing low-level earthquakes. In addition, the process produces large volumes of wastewater, emits greenhouse gases like methane, releases toxic air pollutants, and generates noise. Research has demonstrated that these gas and oil operations can cause habitat loss for animals and plants, species decline, disruption of migration patterns, and land degradation. Additionally, they have been linked to human health risks.

Source: “2011-2014 water use for fracking” by USGS via Wikimedia Commons is in the public domain in the United States.
Soil erosion from wind and water annually robs our nation’s farms of billions of tons of soil. In fact, US farms are currently losing twice as much topsoil to erosion per year as the Great Plains lost in a typical year at the height of the 1930s Dust Bowl, one of the most devastating agricultural and social disasters in our history. Additionally, climate change threatens to amplify erosion impacts over the coming decades, as floods and droughts are expected to grow more severe across much of the nation’s farmland.
The Dust Bowl and Its Legacy
.svg#/media/File:Map_of_states_and_counties_affected_by_the_Dust_Bowl,_sourced_from_US_federal_government_dept._(NRCS_SSRA-RAD).svg)
Source: “Map of states and counties affected by the Dust Bowl, sourced from US federal government dept. (NRCS SSRA-RAD)” by Soil Science and Resource Assessment, Resource Assessment Division (NRCS SSRA-RAD) (Division of the U.S. Dept. Of Agriculture) via Wikimedia Commons is in the public domain.

In the early 20th century, farmers rapidly expanded unsustainable grazing and farming practices throughout the Great Plains. Motivated by rising wheat prices in the 1910s and 1920s, they plowed millions of acres of deep-rooted native grasses and adopted farming methods that left the soil highly vulnerable to erosion. As the Great Depression hit and wheat prices plummeted, desperate farmers plowed even more grassland.
Beginning in 1930, a prolonged period of severe drought struck, leaving the bare, degraded soil at the mercy of the region’s strong winds. Droughts regularly occur on the plains, with severe ones happening approximately every twenty years and milder ones every three to four years. However, there is no historical record of wind erosion like that seen during the droughts of the 1930s. In 1932, there were 14 region-wide dust storms; in 1933, there were 38; in 1934, 22; in 1935, 40; in 1936, 68; in 1937, 72; in 1938, 61; in 1939, 30; in 1940, 17; and in 1941, 17. Amarillo experienced the worst year for dust storms in 1935, with storms lasting a total of 908 hours. From January to March of that year, visibility in Amarillo dropped to zero seven times, with one blackout lasting eleven hours. Additionally, one storm persisted for three and a half days. The devastation was widespread, bankrupting farms and forcing an estimated 400,000 people to migrate. Some areas of the Plains remained depopulated and economically depressed for decades.
In response to this ecological disaster, the federal government implemented various measures to improve soil conservation and combat erosion. This included establishing the Soil Conservation Service, which continues today as the Natural Resources Conservation Service (NRCS) under the US Department of Agriculture.
Marine fisheries — 25% of the world’s marine fisheries are being fished at their maximum level of productivity, and 35% are overfished (yields are declining). To maintain the current per capita fish consumption, global fish harvests must be increased; much of the increase might come through aquaculture, a known source of water pollution, wetland loss, and mangrove swamp destruction.
Biodiversity — Biodiversity is increasingly threatened by development, which destroys or degrades natural habitats and pollution from various sources. The first comprehensive global biodiversity assessment put the total number of species at close to 14 million and found that between 1% and 11% of the world’s species may be threatened by extinction every decade. Coastal ecosystems, which host a very large proportion of marine species, are at great risk, with perhaps one-third of the world’s coasts at high potential risk of degradation and another 17% at moderate risk.
Atmosphere — The Intergovernmental Panel on Climate Change has established that human activities have a discernible influence on global climate. CO2 emissions in most industrialized countries have risen during the past few years. Countries generally failed to stabilize their greenhouse gas emissions at 1990 levels by 2000 as the Climate Change Convention required.
Toxic chemicals — About 100,000 chemicals are now in commercial use, and their potential impacts on human health and ecological function represent largely unknown risks. Persistent organic pollutants are now so widely distributed by air and ocean currents that they are found in the tissues of people and wildlife everywhere; they are of particular concern because of their high toxicity levels and environmental persistence.
Hazardous wastes — Pollution from heavy metals, especially from their use in industry and mining, also creates serious health consequences in many parts of the world. In addition, incidents and accidents involving uncontrolled radioactive sources continue to increase, and particular risks are posed by the legacy of contaminated areas left by military activities involving nuclear materials.
Waste — Domestic and industrial waste production continues to increase in both absolute and per capita terms worldwide. In the developed world, per capita waste generation has increased threefold over the past 20 years; in developing countries, waste generation will likely double during the next decade. However, the level of awareness regarding the health and environmental impacts of inadequate waste disposal remains relatively poor; poor sanitation and waste management infrastructure are still one of the principal causes of death and disability for the urban poor.
Sea Level Rise due to Man-Made Climate Change

Source: “6m Sea Level Rise” by NASA via Wikimedia Commons is in the public domain in the United States.
14.3.6 Traditional Ecological Knowledge (TEK)
The degree to which humans impact the environment in sustainable and/or unsustainable ways is guided by the environmental perspective held by individuals, societies, and cultures. If a culture views the natural world to be part of the human world, this prompts the society to care for the earth and its resources in a more gentle and sustainable way than if a culture views the natural world as separate from humans and existing only for human consumption. Traditional ecological knowledge (TEK) refers to knowledge of the environment often acquired and shared orally from generation to generation; TEK may provide the foundation for the environmental perspective characteristic of a particular culture. As compared with Western scientific knowledge, TEK tends to be more focused on the kinds of solutions and adaptations to environmental challenges that span time and generations as opposed to producing a quick fix. In addition, TEK tends to be more interrelated to individual and cultural identity and spirituality that Western scientific knowledge and practices.
Watch the linked and embedded video below and reflect on the following:
- How do people in the videos explain the importance and value of TEK as opposed to Western knowledge? What does it provide?
- How is TEK transmitted and how can this transmission be disrupted?
Also check this link out;
First Stories: Nganawendaanan Nde’ing (I Keep Them In My Heart)
