
Chapter 12: Urban and Suburban Spaces
12.6 City Distribution and Size
12.6.1 Central Place Theory
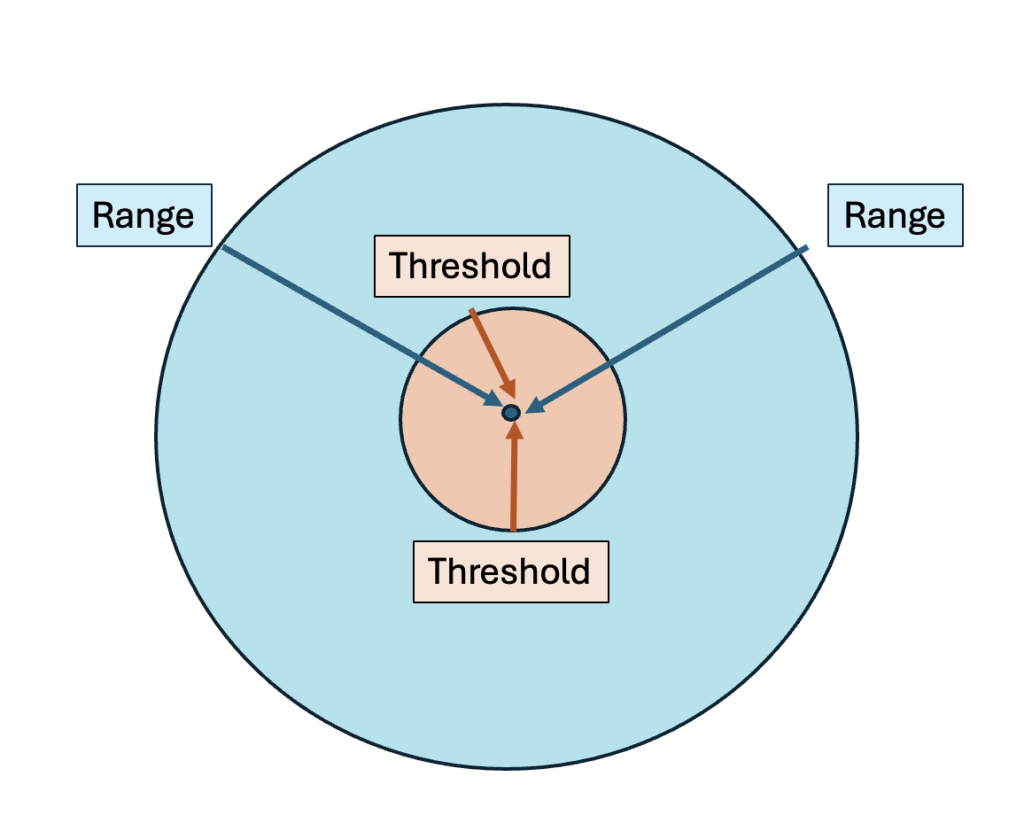
Cities are connected, interrelated, and distributed in somewhat predictable ways. Cities organize according to an urban hierarchy which tends to create a distribution of cities on the basis of size and services. These interrelated concepts were placed together by Walter Christaller in 1933 as Central Place Theory. In 'central places' goods and services are available for purchase. The more central a place is, more goods and services are available. Goods and services have a range, which is the distance a customer is willing to travel to consume the good or service and a threshold which is the minimum number of regular customers to keep businesses afloat.
Often, a regular, geometric pattern of cities could and can be observed. This process was more pronounced when transportation was primitive, and the friction of distance was considerable, but it can still be witnessed by picking up a map of almost any flat region of the earth. Geographer Walter Christaller noticed the pattern and developed his theory to explain the pattern and the logic driving it forward.
According to Christaller, if a group of people (like farmers) diffuse evenly across a plain (as they were when Kansas opened for homesteaders), a predictable hierarchy of villages, towns, and cities will emerge. The driving force behind this pattern is the basic need everyone has to go shopping for goods and services. Naturally, people prefer to travel less to acquire what they need. As mentioned above, the maximum distance people will travel for a good or service is the range of that good or service. Goods like a hammer have a short-range because people will not travel far to buy a hammer (see Figure 12. ) A tractor, because it is an expensive item, has a much higher range. The cost of getting to a tractor dealership is small about the value of the tractor itself, so farmers will travel long distances to buy the one they want. Hospital services have even higher ranges. People might travel to the moon if a cure for a deadly disease was available there.
Each merchant and service provider also requires a minimum number of regular customers to stay in business. Christaller called this number the threshold population. A major-league sports franchise has a threshold population of probably around a million people, most of whom must live in that team’s range. There are only 30 Major League Baseball teams in the United States, and the team with the smallest market (Milwaukee Brewers) has a threshold population of 2 million people. An ordinary Wal-Mart store probably has a threshold of about 20,000 people, so they are far more numerous. Starbuck’s Coffee shops probably have a threshold of about 5,000 people or less, judging by the many locations.

Source: "Christaller's central place theory animation" by Avenafatua via Wikimedia Commons is in the public domain.
When customers and merchants living and working on featureless plain interact over time, some villages will attract more merchants (and customers) and grow into towns or even cities. Some communities will not be able to attract or retain merchants, and they will not grow. Competition between towns on this plain prevents nearby locations from increasing simultaneously. As a result, centrally located villages tend to grow into towns at the expense of their neighbors. A network of centrally located towns will emerge, and among these towns, only a few will grow into cities. One very centrally located city may evolve into a much larger city.
Small settlements like towns, villages, or hamlets have limited centrality and only provide goods and services with shorter range. These places provide for the people in the immediate area, such as those living in the hinterland. Larger settlements provide more goods and services, and some of those goods and services have a larger range, pulling customers from further away. These longer range goods and services may be those that are more expensive or of infrequent use. The result geographically is an urban system in which there are many smaller-sized places surrounding a few large, somewhat far apart large areas.
You as a reader have likely experienced this concept without knowing the theory behind it! If you are home, and notice that you are out of milk, you are probably going to walk or drive to a shop less than 10 minutes away. Likewise, people do not travel hundreds of miles in order to purchase gasoline for a car. These are goods that have a short range, and therefore we see lots of small settlements, fairly close together, in order to provide people with daily goods. On the other end of the spectrum, major professional sports, operas, and other cultural services are only found, with few exceptions, in the largest of cities. Customers are often willing to travel long spatial and temporal distances for these services. The same pattern is seen when looking at a single good. The types of automobiles available for purchase follow a similar pattern. Small settlements may have used car lots with inexpensive cars. Somewhat larger places will have dealerships for mainline or common makes like Ford and Honda. In even larger/more central places, higher-end brands like BMW and Lexus emerge. And, in only a few major cities are you likely to find the most luxurious brands like Bentley and Lamborghini. One is unlikely to find a Tesla storefront in a tiny village!
Like the geo-economic models outlined above, Central Place Theory depends on assumptions of ideal conditions. If the ground is featureless and ubiquitous, and if transportation is equal in all places, the hierarchy of central places will be hexagonal in shape. The largest cities will be in a hexagonal pattern, with mid-sized cities arranged around each in a hexagon, with smaller cities around each of those in a hexagon, and so on down to the smallest settlements.
12.6.2 Primate Cities
When customers and merchants living and working on featureless plain interact over time, some villages will attract more merchants (and customers) and grow into towns or even cities. Some villages will not be able to attract or retain merchants, and they will not grow. Competition between towns on this plain prevents neighboring locations to grow simultaneously. As a result, centrally located villages tend to grow into towns at the expense of their neighbors. A network of centrally located towns, will emerge and among these towns only a few will grow into cities. One very centrally located city may evolve into a much larger city.
The largest cities will have business and functions that require large thresholds (like major league sports teams or highly specialized boutiques). People from villages and small towns can access only the most basic goods and services (like gas stations or convenience stores) and are forced to travel to larger cities to buy higher order goods and services. Those goods and services not available to the nearest large city (regional service center) require customers to travel further. Some goods and services are only available at the top of the urban hierarchy; the mega-cities. I
In the United States, a handful of cities (New York, Los Angeles, Chicago, and Dallas) may offer exceptionally high order goods, unavailable in other large cities like Cleveland, Seattle or Atlanta.
Geographer Mark Jefferson developed the law of the primate city to explain the phenomenon of huge cities that capture such a large proportion of a country's population as well as its economic activity. These primate cities are often, but not always, the capital cities of a country. An excellent example of a primate city is Paris, which truly represents and serves as the focus of France. They dominate the country in influence and are the national focal point. Their sheer size and activity become a strong pull factor, bringing additional residents to the city and causing the primate city to become even larger and more disproportional to smaller cities in the country.
However, not every country has a primate city, as you'll see from the list below. Some scholars define a primate city as one that is larger than the combined populations of the second and third ranked cities in a country. This definition does not represent true primacy, however, as the size of the first ranked city is not disproportionate to the second. The law can be applied to smaller regions as well. For example, California's primate city is Los Angeles, with a metropolitan area population of 16 million, which is more than double the San Francisco metropolitan area of 7 million. Even counties can be examined with regard to the Law of the Primate City.
Examples of Countries with Primate Cities
- Paris (9.6 million) is the focus of France while Marseilles has a population of 1.3 million.
- Similarly, the United Kingdom has London as its primate city (7 million) while the second largest city, Birmingham, is home to a mere one million people.
- Mexico City, Mexico (8.6 million) outshines Guadalajara (1.6 million).
Examples of Countries that Lack Primate Cities
- India's most populous city is Mumbai (formerly Bombay) with 16 million; second is Kolkata (formerly Calcutta) with more than 13 million, and third is less than 13 million.
- China, Canada, Australia, and Brazil are additional examples of non-primatecity countries.
- Utilizing the metropolitan area population of urban areas in the United States, we find that the U.S. lacks a true primate city. With the New York City metropolitan area population at approximately 21 million, second ranked Los Angeles at 16 million, and even third-ranked Chicago at 9 million, America lacks a primate city.
In 1949, George Zipf devised his theory of rank-size rule to explain the size cities in a country. He explained that the second and subsequently smaller cities should represent a proportion of the largest city. For example, if the largest city in a country contained one million citizens, Zipf stated that the second city would contain one-half as many as the first, or 500,000. The third would contain one-third or 333,333, the fourth would be home to one-quarter or 250,000, and so on, with the rank of the city representing the denominator in the fraction. While some countries' urban hierarchy somewhat fits into Zipf's scheme, later geographers argued that his model should be seen as a probability model and that deviations are to be expected.
12.6.3 City Size Distribution
In 1950, out of the world’s 30 largest metropolitan areas, the first three metropolitan areas were in lower income countries: New York (U.S.), Tokyo (Japan), and London (UK), two of which (New York and Tokyo) had more than 10 million inhabitants. 30 years later, in 1980, a significant change was recorded. Although metro New York increased from 12.3 million to 15.6 million, Tokyo, with 28.5 million inhabitants, became the largest metropolitan area in the world, a position which the city still maintains. In addition, except for Osaka, the second metropolitan area from Japan, two large metropolitan areas in lower income countries were added: Mexico City (Mexico) and Sao Paulo (Brazil). The number of large metropolitan areas continued to increase after 2010, adding more lower income countries such as India (Delhi and Mumbai/Bombay), China (Shanghai and Beijing), Bangladesh (Dhaka), and Pakistan (Karachi) from Asia; and Egypt (Cairo), Nigeria (Lagos), and Democratic Republic of the Congo (Kinshasa) from Africa. Each of these metropolitan areas is expected to have over 20 million inhabitants after 2020; Delhi and Shanghai are added to the largest metropolitan areas with over 30 million inhabitants. In the United States, New York-Newark is the largest metropolitan area, in which the population was constantly increasing from 12.3 million in 1950 to 15.6 million in 1980 and 18.3 million in 2010, having the potential to reach 20 million in 2030. Yet, unlike the lower income countries which are characterized by a very fast urban growth rate the higher income countries had recorded a moderate urban growth rate.
| 1950 | 1980 | 2010 | 2020 | 2025 | 2030 | |
|---|---|---|---|---|---|---|
| World |
New York-12.3 Tokvo-11.2 London-8.3 |
Tokvo-28.5 Osaka-17.0 New York-15.6 Mexico City-13.3 Sao Paulo-12.0 |
Tokyo-36.8 Delhi-21.9 Mexico City-20.1 Shanghai-19.9 Sao Paulo-10.6 Osaka-19.4 Bombay-19.4 New York- Newark-18.3 Cairo-16.0 Beijing-16.1 |
Tokyo-38.3 Delhi-29.3 Shanghai-27.1 Beijing-24.2 Bombay-22.8 Sao Paulo-22.1 Mexico City-21.8 Dhaka-20.9 Cairo-20.5 Osaka-20.5 |
Tokyo-37.8 Delhi-32.7 Shanghai-29.4 Beijing-26.4 Bombay-25.2 Dhaka-24-3 Mexico City-22.92 Sao Paulo-22.90 Cairo-22.4 Karachi-22.01 Osaka-20.3 Lagos-20.03 |
Tokyo-37.19 Delhi-36.06 Shanghai-3o.7 Bombav-27.8 Beijing-27.7 Dhaka-27.3 Karachi-24.8 Cairo-24.5 Lagos-24.2 Mexico City-23.8 Sao Paulo-23.4 Kinshasa-20.00 |
| United States | New York- Newark-12.3 Chicago-5.0 Los Angeles- Long Beach- Santa Ana 4.0 Philadelphia 3.1 Detroit 2.7 Boston 2.5 San Francisco- Oakland-1.8 |
New York- Newark-15.6 Los Angeles- Long Beach- Santa Ana-9.5 Chicago-7.2 Philadelphia-4.5 |
New York- Newark-18.3 Los Angeles- Long Beach- Santa Ana-12.1 |
New York- Newark-18.7 Los Angeles- Long Beach- Santa Ana-12.4 |
New York. Newark-19.3 Los Angeles- Long Beach- Santa Ana-12.8 |
New York- Newark-19.8g Los Angeles- Long Beach- Santa Ana- 13.26 |
Figure 12.6.3 | The World’s 30 Largest Metropolitan Areas, Ranked by Population Size
The maps below, created by the United Nations Population Division, illustrate the growth and projected growth of urban populations globally. Notably, 2008 marked the year when it was determined that half of the world's population resided in urban areas. By 2018, the Americas and Europe were already highly urbanized. Projections for 2030 indicate that the regions with moderate urbanization (40-60% urban, shown in yellow) and low urbanization (20-40% urban, shown in green) will predominantly be found in Sub-Saharan Africa, South, Southeast, and Central Asia. However, most of the city growth is found in South and Southeast Asia, a function of their large populations.

Source: "Percentage urban and urban agglomerations by size class map" by United Nations, DESA, Population Division is licensed under CC BY 3.0 IGO.

Source: "Percentage urban and urban agglomerations by size class map" by United Nations, DESA, Population Division is licensed under CC BY 3.0 IGO.
The Globalization and World Cities Research Network (GaWC) is a think tank in the UK that studies the relationships between world cities in the context of globalization. The GaWC evaluates cities globally to compile a roster of world cities, ranking them based on their connectivity through four "advanced producer services": accountancy, advertising, banking/finance, and law. This inventory prioritizes city economics over political or cultural factors. In addition to the categories of "Alpha" world cities (with four sub-categories), there are Beta cities and others.
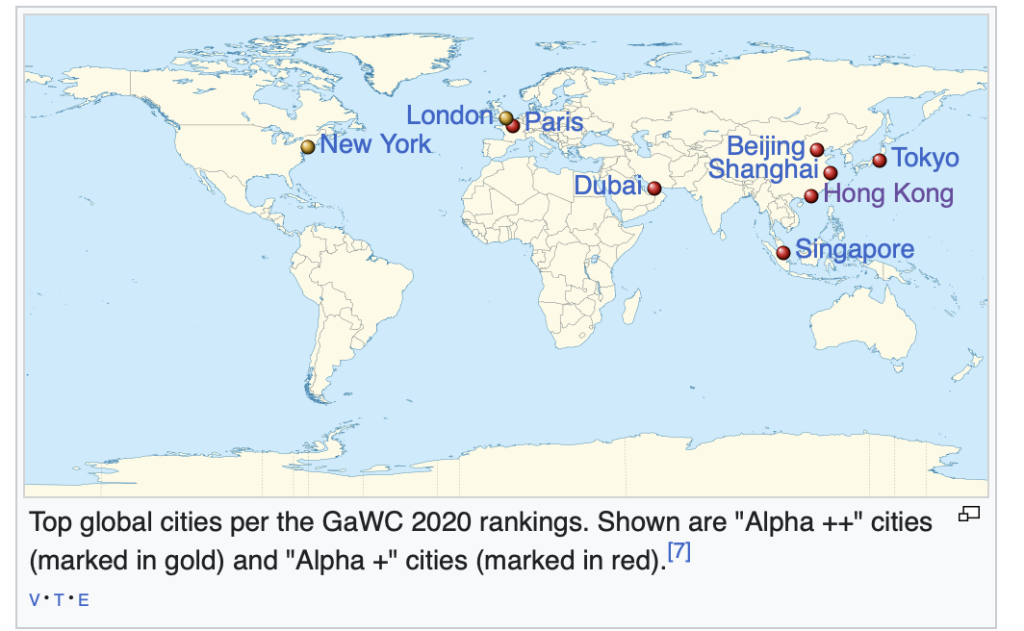
Source: "Top global cities per the GaWC 2020 rankings" derivative work of TUBS' "World location map (equirectangular 180)" via Wikimedia Commons, CC BY-SA 3.0.
The classification results - as seen in the map above -- for 2022 are derived from the activities of 175 leading firms providing advanced producer services across 802 cities worldwide. The results should be interpreted as indicating the importance of cities as nodes in the world city network (i.e. enabling corporate globalization). According to this study, only New York City and London were rated as Alpha++ cities, followed by Alpha+ cities listed in the map.
These are at present the leading cities in terms of globalization.
