
Chapter 11: Economy and Development
11.9 Global Infrastructure
11.9.1 Global Access to Electricity

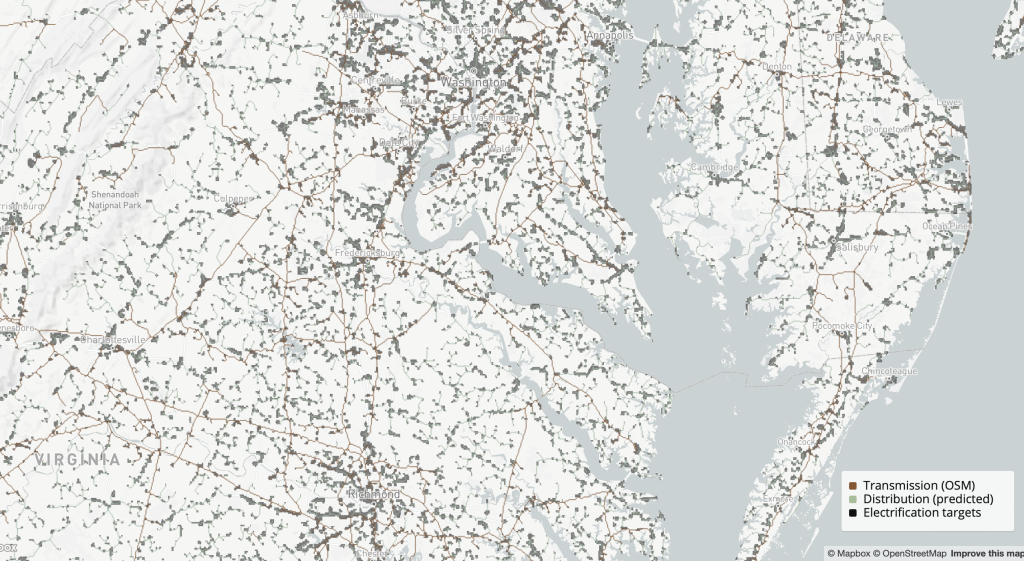
Source: “Predictive mapping of the global power system using open data” via Zenodo.org is licensed under CC BY 4.0.
Obviously electricity is one of the first steps in the development of an area. To make informed investment decisions in areas still lacking adequate electricity grids, it is essential to have precise knowledge of the current grid’s locations. This is the reason the map above was created.
In its drive for universal access to electricity, the World Bank is focusing on supporting the most cost-effective systems and technologies to deliver electricity to those who need it most. However, this effort assumes that we have accurate information about where people do and do not have access to electricity, which is often not the case. A new tool aims to make electrification planning more efficient and cost-effective by predicting the locations of existing infrastructure and connections. One method to monitor electricity access is by using “night lights” imagery from the Suomi NPP satellite. This satellite passes over nearly every point on Earth around 1:30 am local time, capturing high-resolution photographs that reveal the amount of light emitted worldwide. This technique has previously been employed to estimate electricity access in remote areas and to guide grid extension programs.
The hypothesis is that locations visible at night (after accounting for clouds, reflections, and fires) are settlements with electricity access, likely supplied by an electrical grid. This assumes that small off-grid systems do not emit enough light to be detected, while larger, isolated power networks are clearly visible.
This raises the question of where to locate other electric networks, such as medium voltage infrastructure, that are not easily detectable by satellite..The makers of the map created an algorithm that took into account existing road networks on the asssumption that medium voltage infrastructure would follow existing roadways. While it’s important to recognize the limitations of this approach and acknowledge that there is no substitute for local knowledge and on-the-ground surveying, this new tool provides countries and lenders with the opportunity to make reasonably detailed initial assessments and better target further interventions.
Source: “Predictive mapping of the global power system using open data” via Zenodo.org is licensed under CC BY 4.0.
You can click on the map to zoom into your specific area. Overall, this provides a comprehensive overview of where electricity is available and where it is not. The absence of electricity in certain areas might be due to topographical challenges, as mountains, lakes, and large desert regions tend to be sparsely populated, reducing the demand for electricity.
While the map above contains the latest data, the World Bank published a country-based overview map showing where most people in the world have access to electricity:
African nations in general do not have the same access to electricity as most other countries in the world. According to Afrobarometer[1]
The issue of electricity access varies greatly across countries. Many North African and island nations achieve high access rates, while several countries have extended the electric grid to only a third or less of their territory. Examples include Burundi (17%), Burkina Faso (25%), Sierra Leone (29%), Niger (30%), Guinea (31%), Liberia (31%), and Mali (32%).
The next step is determining whether the electricity grid actually connects to households. In some cases, the grid is nearby, but homes lack direct connections. However, even when connected, a reliable electricity supply is not guaranteed due to intermittent power. In South Africa, 14% of those with an electric connection report that power never or only occasionally works. This issue is even more pronounced in Zimbabwe (44%), Zambia (33%), Botswana (23%), Namibia (19%), and Kenya (15%).
11.9.2 Global Access to Internet
Digital infrastructure is essential for providing inclusive, affordable, safe, and resilient internet access, driving growth, job creation, and services for individuals and businesses. However, the digital divide remains significant, with nearly 3 billion people (roughly 37% of the world’s population!) unconnected to the internet in 2023. Telecommunications markets need to be unhanced, broadband coverage expanded, and access increased to ensure productive use, and inclusion.
However, internet availability alone is insufficient—people must also be able to afford it and possess the knowledge to use it safely and productively. This challenge is especially pronounced for disadvantaged groups, including low-income individuals and households, women, the disabled, and the elderly.
Figure 11.9.4 Individuals using the internet as percent of the population. Visit the map site to find more information.
Source: “Individuals using the Internet (% of population)” by World Bank Group is licensed under CC BY 4.0.
Obviously in order for anyone to use the internet they will need access to electricity and be it only to charge up a battery of a mobile phone. According to an article by CNN, Afrobarometer reported in 2016 that in Africa 93% of people surveyed in 36 African countries have cell phone service but only 65% electricity and 54% paved roads. This is somewhat different In North Africa, where the population is generally more urbanized and geographically centralized compared to most sub-Saharan African countries. Thus they experience a lesser need for extensive rural electrification efforts, allowing the focus to be on urban areas. Additionally, higher levels of economic development may further support electrification.
11.9.3 Global Road Structure

Source: “Figure 3. The GRIP global road maps, displaying the detailed and harmonized coverage over world regions and the coverage per individual road type.” from Johan R Meijer et al 2018 Environ. Res. Lett. 13 064006. DOI 10.1088/1748-9326/aabd42
The authors of the article Global patterns of current and future road infrastructure [2]found that there is a positive relationship of road length with GDP, membership in the Organisation for Economic Co-operation and Development (OECD) and population density. Basically, road densities are higher in developed countries with higher GDP, like those in Northwest Europe, as well as more densely populated countries like India, Bangladesh and Rwanda. In addition, it is possible that increases in population density and GDP result not only in the construction of new roads, but also an increased use of existing roads.
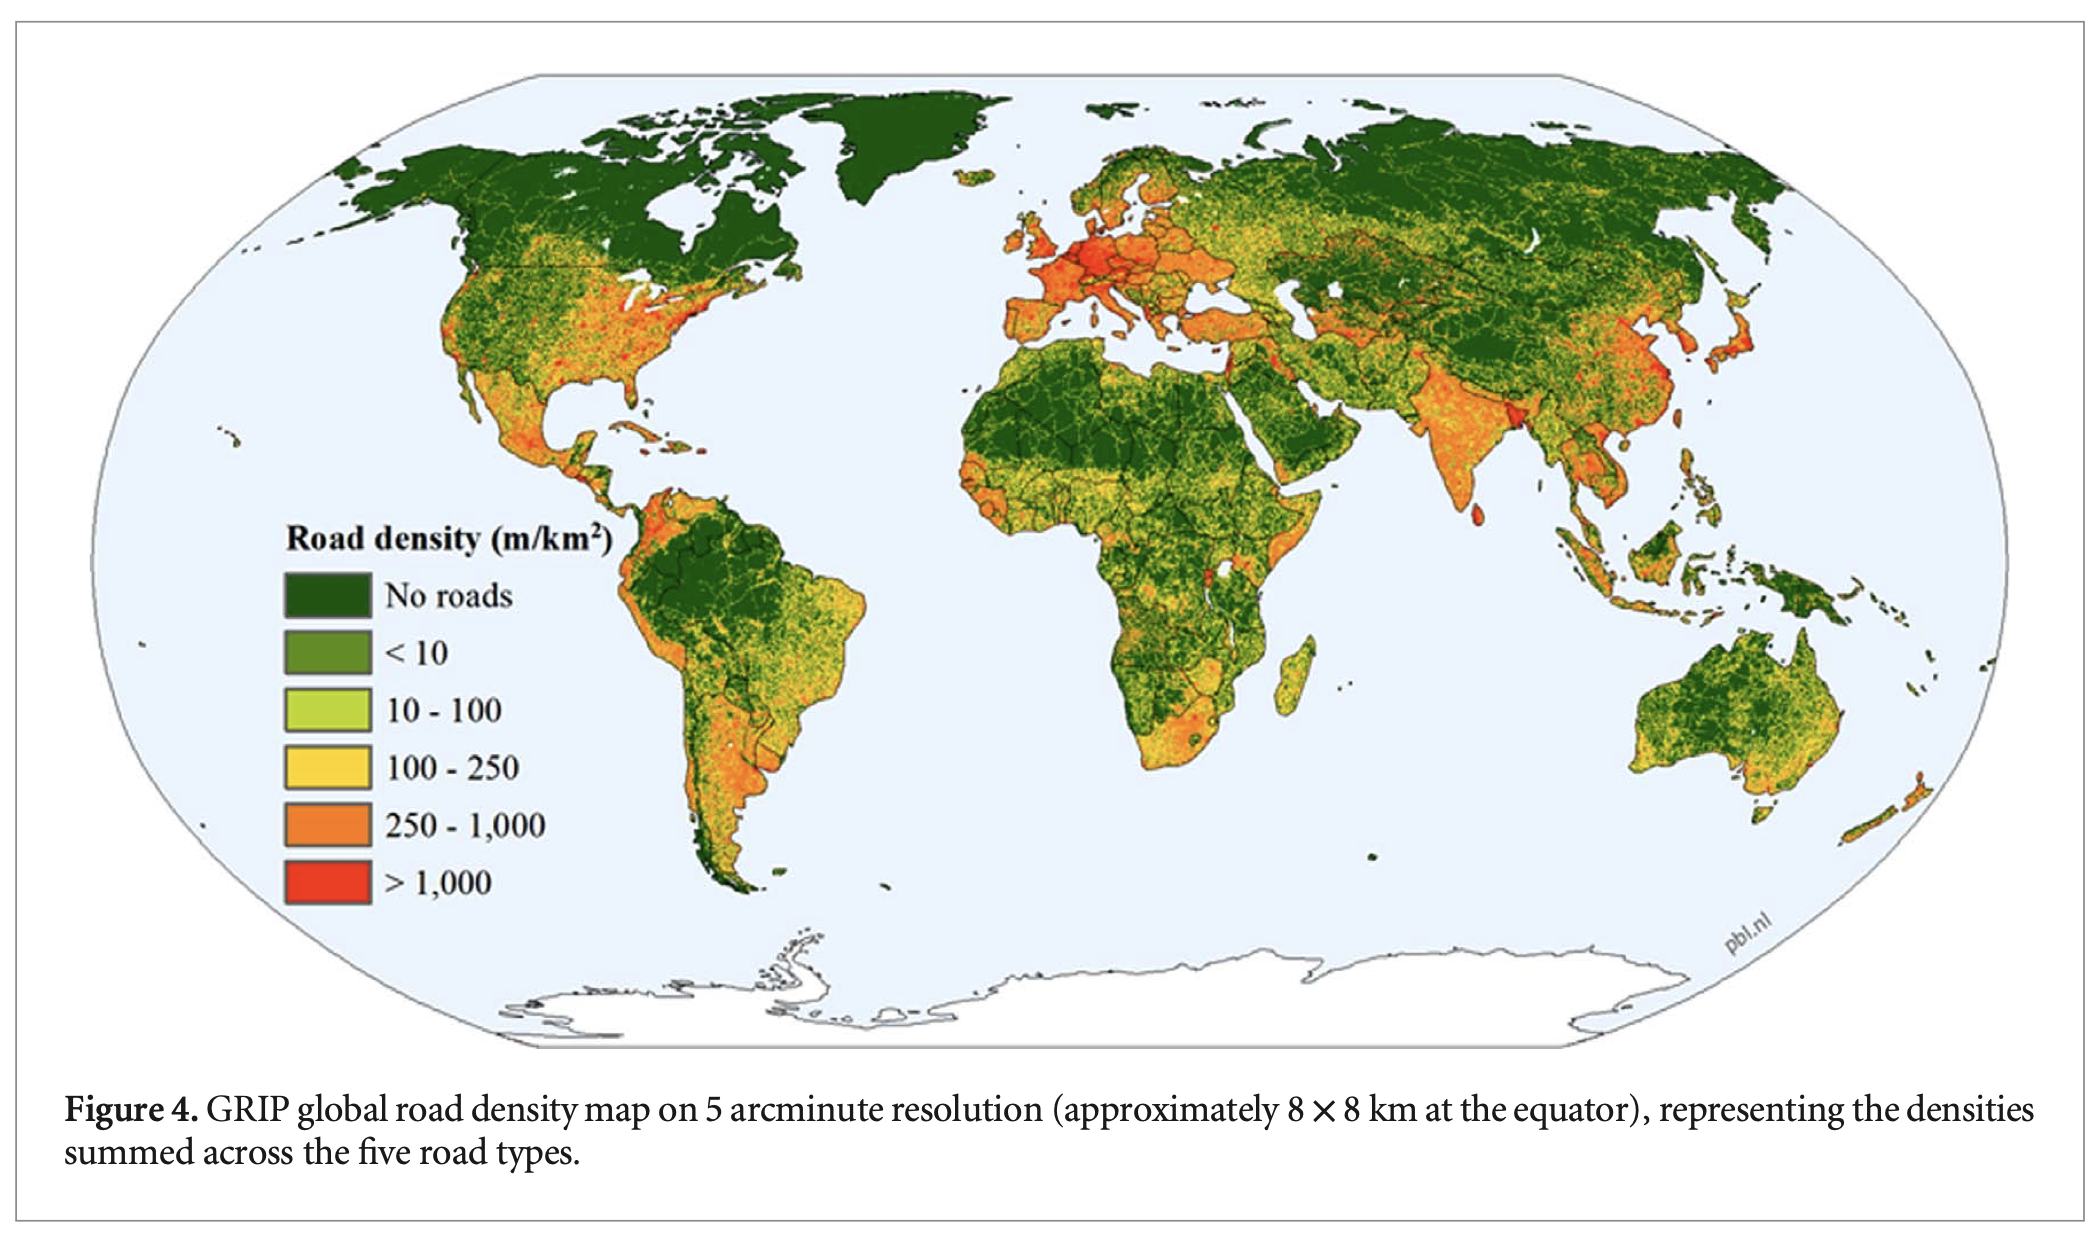
Source: “Figure 4. GRIP global density map on 5 arcminute resolution (approximately 8X8 km at the equator), represeting the densitites summed across the five road types.” from Johan R Meijer et al 2018 Environ. Res. Lett. 13 064006. DOI 10.1088/1748-9326/aabd42
For more information on roads around the world visit this VisualCapitalist website.
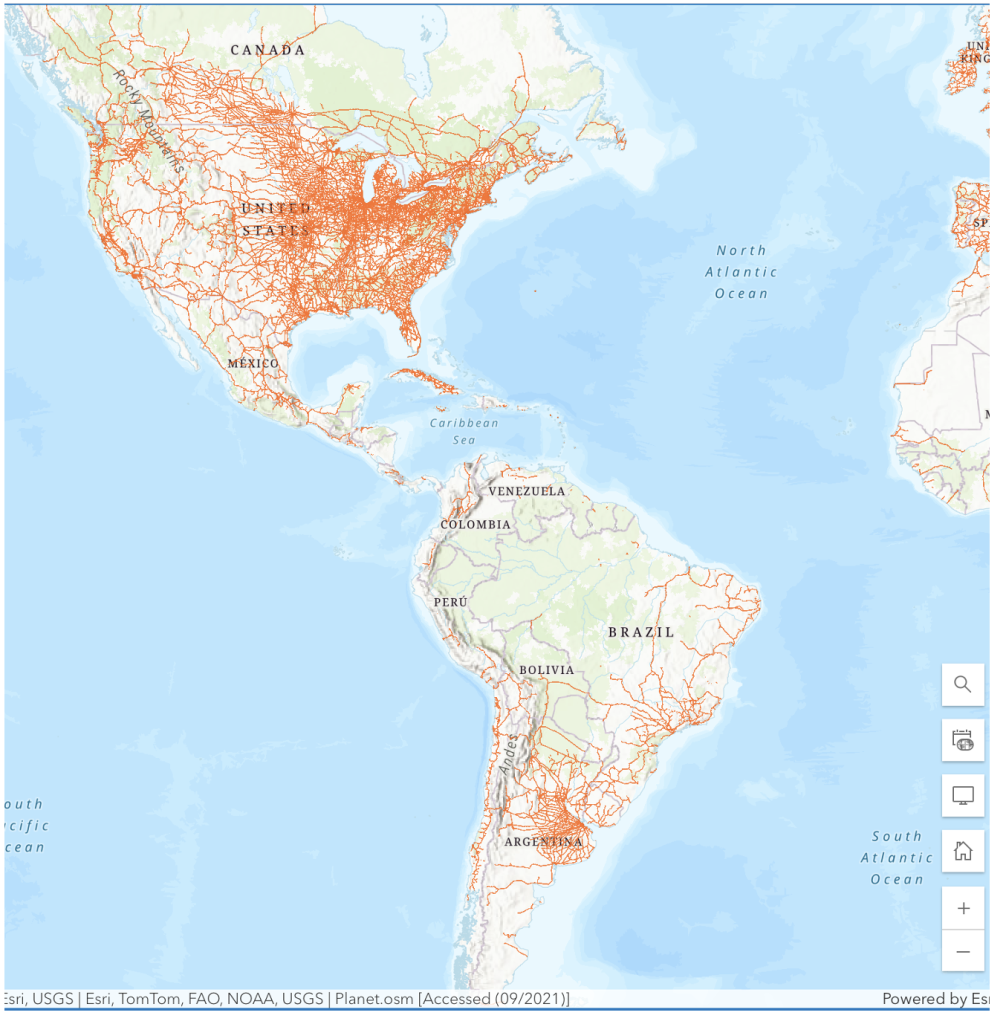
11.9.4 Global Railroad Availability
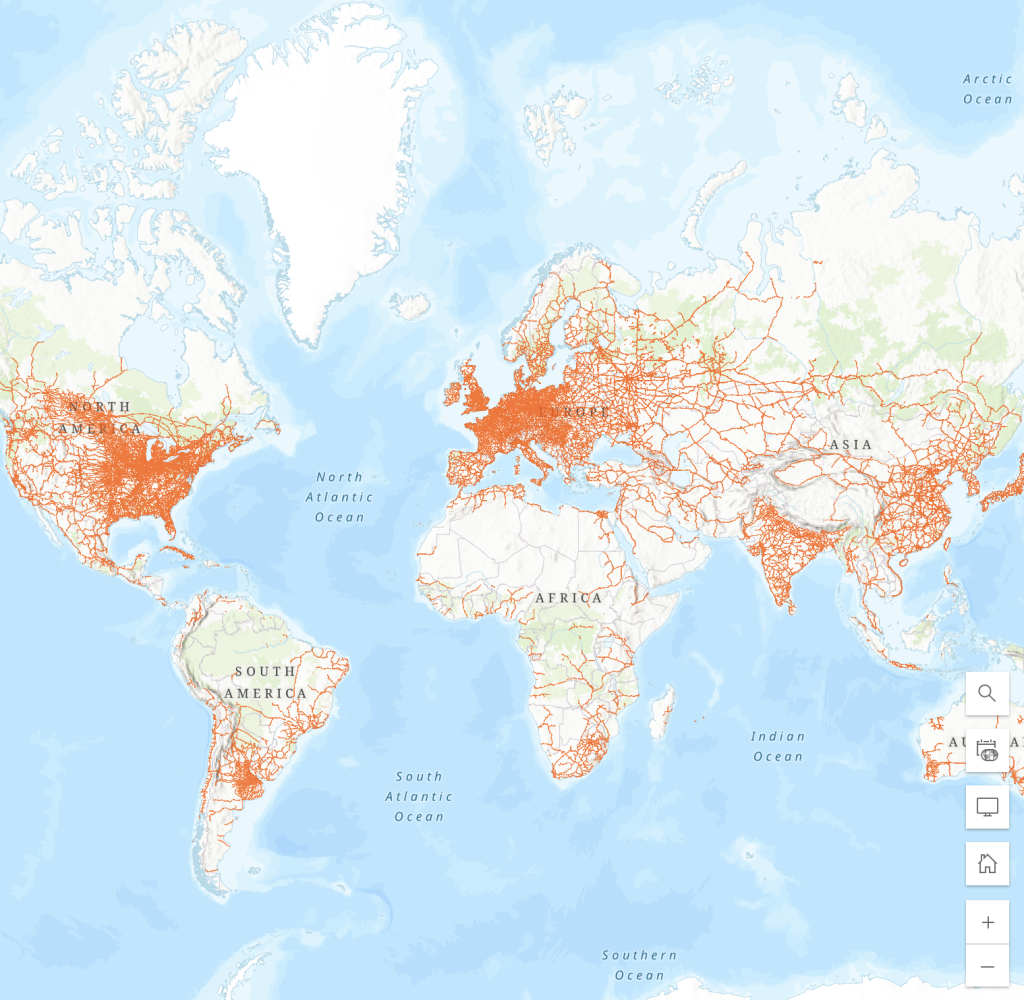
Source: Screenshot of the ArcGIS Open Street Map.
Before interpreting the maps, it should be noted that OpenStreetMap (OSM) is a digital map database of the world built through crowdsourced volunteered geographic information (VGI). Therefore, there is no systematic quality check performed on the data, and the detail, precision and accuracy varies across space.While at first glance the global railroad network seems to be similar to that of the roadways, a closer look at zoomed-in maps shows that much of northern Russia appears to be devoid of railways. However, some of the ports along Russia’s northern coast are being developed because of the melting ice and the soon-to-be possible passage of freighters. This development plans to also extend the railway. It is also interesting to note that most of Europe’s railway system is very dense with the exception of Eastern Europe. India and China, despite their high population density, also seem to have a less dense railroad system. Of interest is also that in South America the railway network seems well developed in northern Argentina but not so much in Brazil.
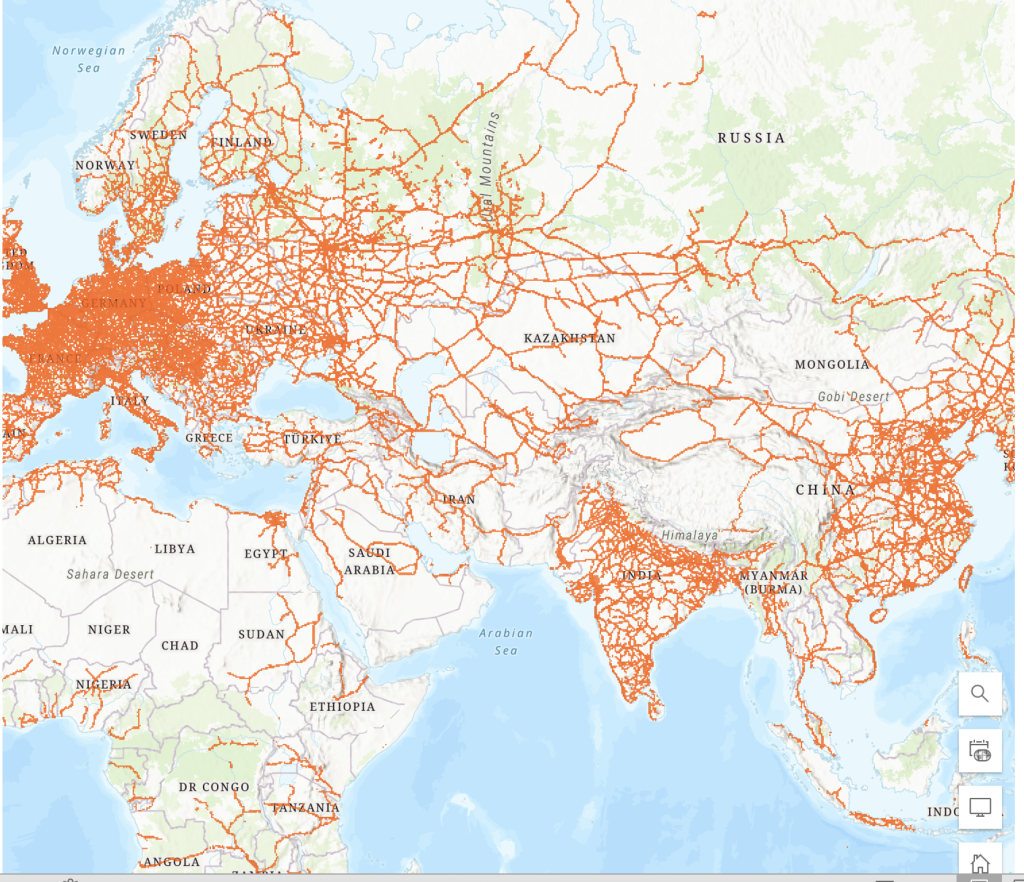
Source: Screenshot of the ArcGIS Open Street Map.
Source: Screenshot of the ArcGIS Railways Map.
11.9.5 Global Airport Distribution

Source: “Map of airports according to the number of destinations, Reprinted with permission. Copyright 2020 FlightConnections.” via Research Gate is licensed under CC BY 4.0
- a non-profit company with headquarters in Ghana and pan-African, non-partisan survey research network one of the most significant disparities is evident in the 36 countries they surveyed, where 94% of urban residents have access to the electric grid, compared to only 45% in rural areas. The urban-rural divide is most pronounced in Guinea, Mali, and Niger, indicating that major cities, including capitals, have relatively good grid coverage, while rural areas remain severely lacking. ↵
- Johan R Meijer et al 2018 Environ. Res. Lett. 13 064006 Global patterns of current and future road infrastructure ↵
