
Chapter 10: Agricultural and Food Systems
10.6 Spatial Geography of Food
Spatial Geography of Food The transformation of agriculture into large-scale agribusiness has created a complex system linking food production with consumers. Here is how we think of our modern food system:
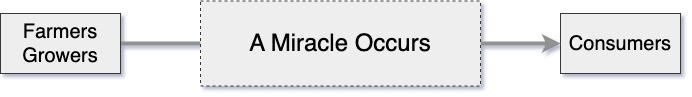
This miraculous system which causes food to appear in grocery stores is an illusion. Somehow, we imagine the farmer pulling his or her truck up behind the supermarket and unloading baskets of fresh fruits and vegetables or sides of beef and pork into the open arms of the retailer and his staff. And, frankly, the bigger the supermarket, the more likely there will be signs, photos, and even wall-sized murals showing farmers and ranchers smiling as they offer their vegetables and fruit or stand with an arm around the neck of a sleek beef cow.
In reality, the path our food takes to get to our plates is more like a messy game of hopscotch.
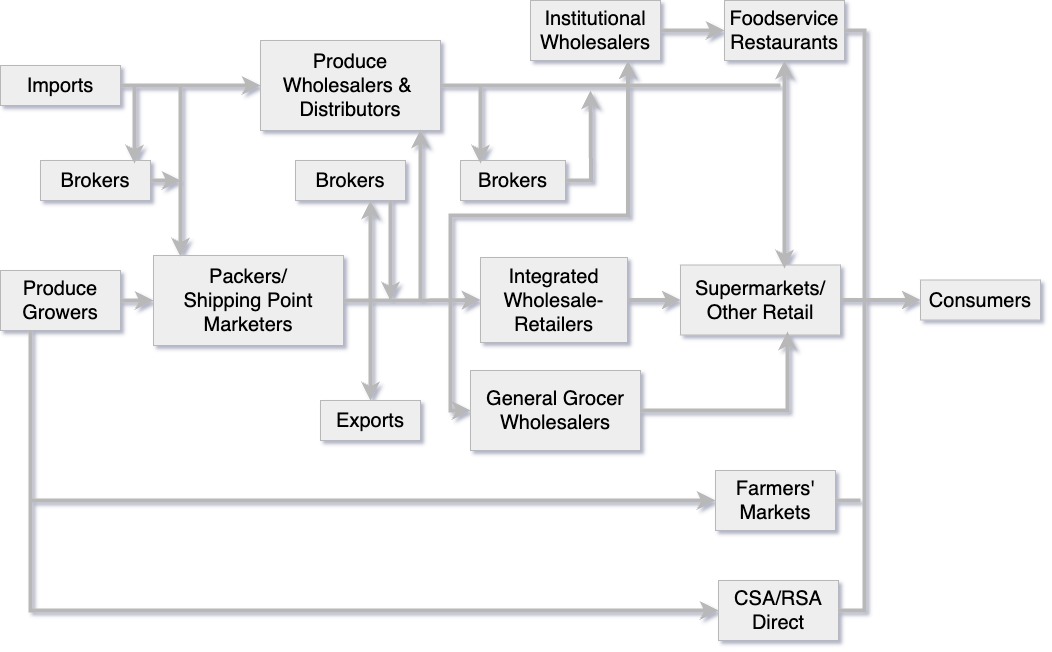
A commodity a raw material or primary agricultural product that can be bought and sold, such as copper or coffee. A commodity chain (or supply chain) is a common tool that geographers, economists, and other social scientists use to understand the journey of a particular resource, from when it is first extracted through processing and refining, to when it is sold and consumed as a finished product. This tool is especially useful for tracing the connections between the places and people involved, and the impact that our demand for a commodity has on the environment.
Key Terms:
A commodity a raw material or primary agricultural product that can be bought and sold, such as copper or coffee.
A commodity chain (or supply chain) is a common tool that geographers, economists, and other social scientists use to understand the journey of a particular resource, from when it is first extracted through processing and refining, to when it is sold and consumed as a finished product. This tool is especially useful for tracing the connections between the places and people involved, and the impact that our demand for a commodity has on the environment.
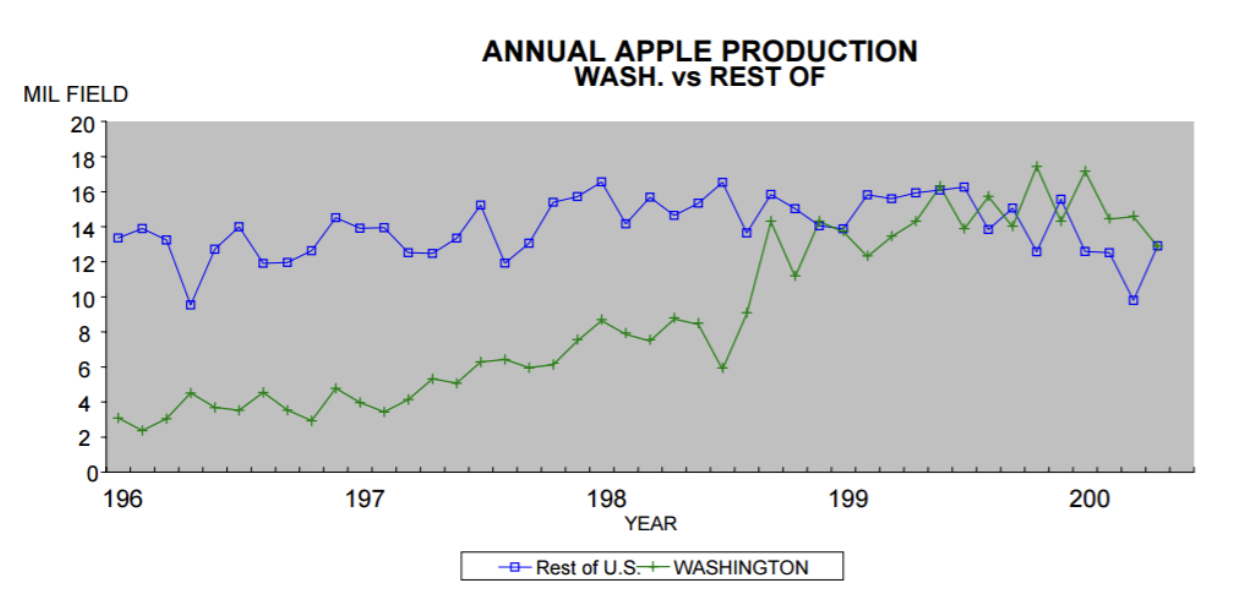
A geographer thinks of these complex supply chains in a global spatial context. Each stop along the way from food producers to consumers represents part of the agricultural landscape. So, how far does our food travel before it gets to our plates? Consider the journey of a Washington apple. Washington State is one of the largest producers of apples in the United States (Figure 5.21) however, the processing of apples for juice and apple sauce occurs all across the country, with one of the largest operations being Knouse Foods in Pennsylvania. That means if you live next to an orchard in Wenatchee, Washington and you go to the local grocery store for applesauce, it’s likely to have traveled about 5,300 miles from Washington to Pennsylvania and back again.
Source: Retrieved from “5.6 Spatial Geography of Food” in Human Geography: An open textbook for advanced placement. by the Puyallup School District is licensed under CC BY.
This is not the exception, but rather the rule, in our current food system. Shipping food long distances for processing and packaging, importing and exporting foods that don’t need to be imported or exported – these are standard practices in the food industry. According to one report, in 1996, Britain imported more than 114,000 metric tons of milk. Was this because British dairy farmers did not produce enough milk for the nation’s consumers? No, since the UK exported almost the same amount of milk that year, 119,000 tons.
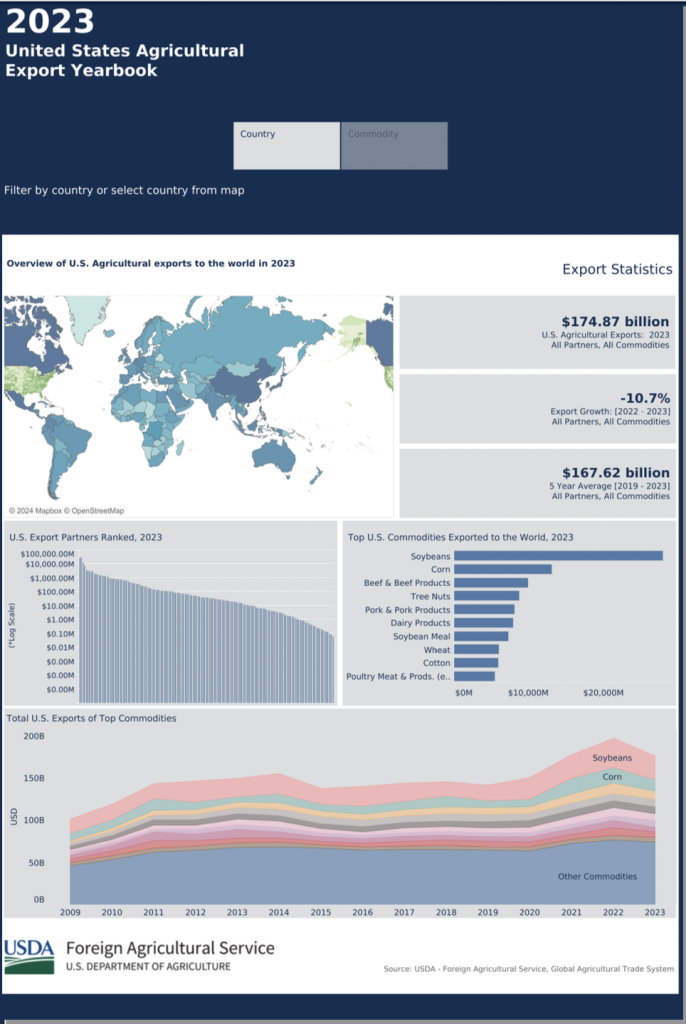
On the Visualization: 2023 U.S. Agricultural Export Yearbook website, you can click on any country and you will get a good feel what kinds of food that country imports from the US. Below is a chart displaying the 2020 top export countries along with their primary food exports: Notice that some countries export the same food commodity that they import.[1]
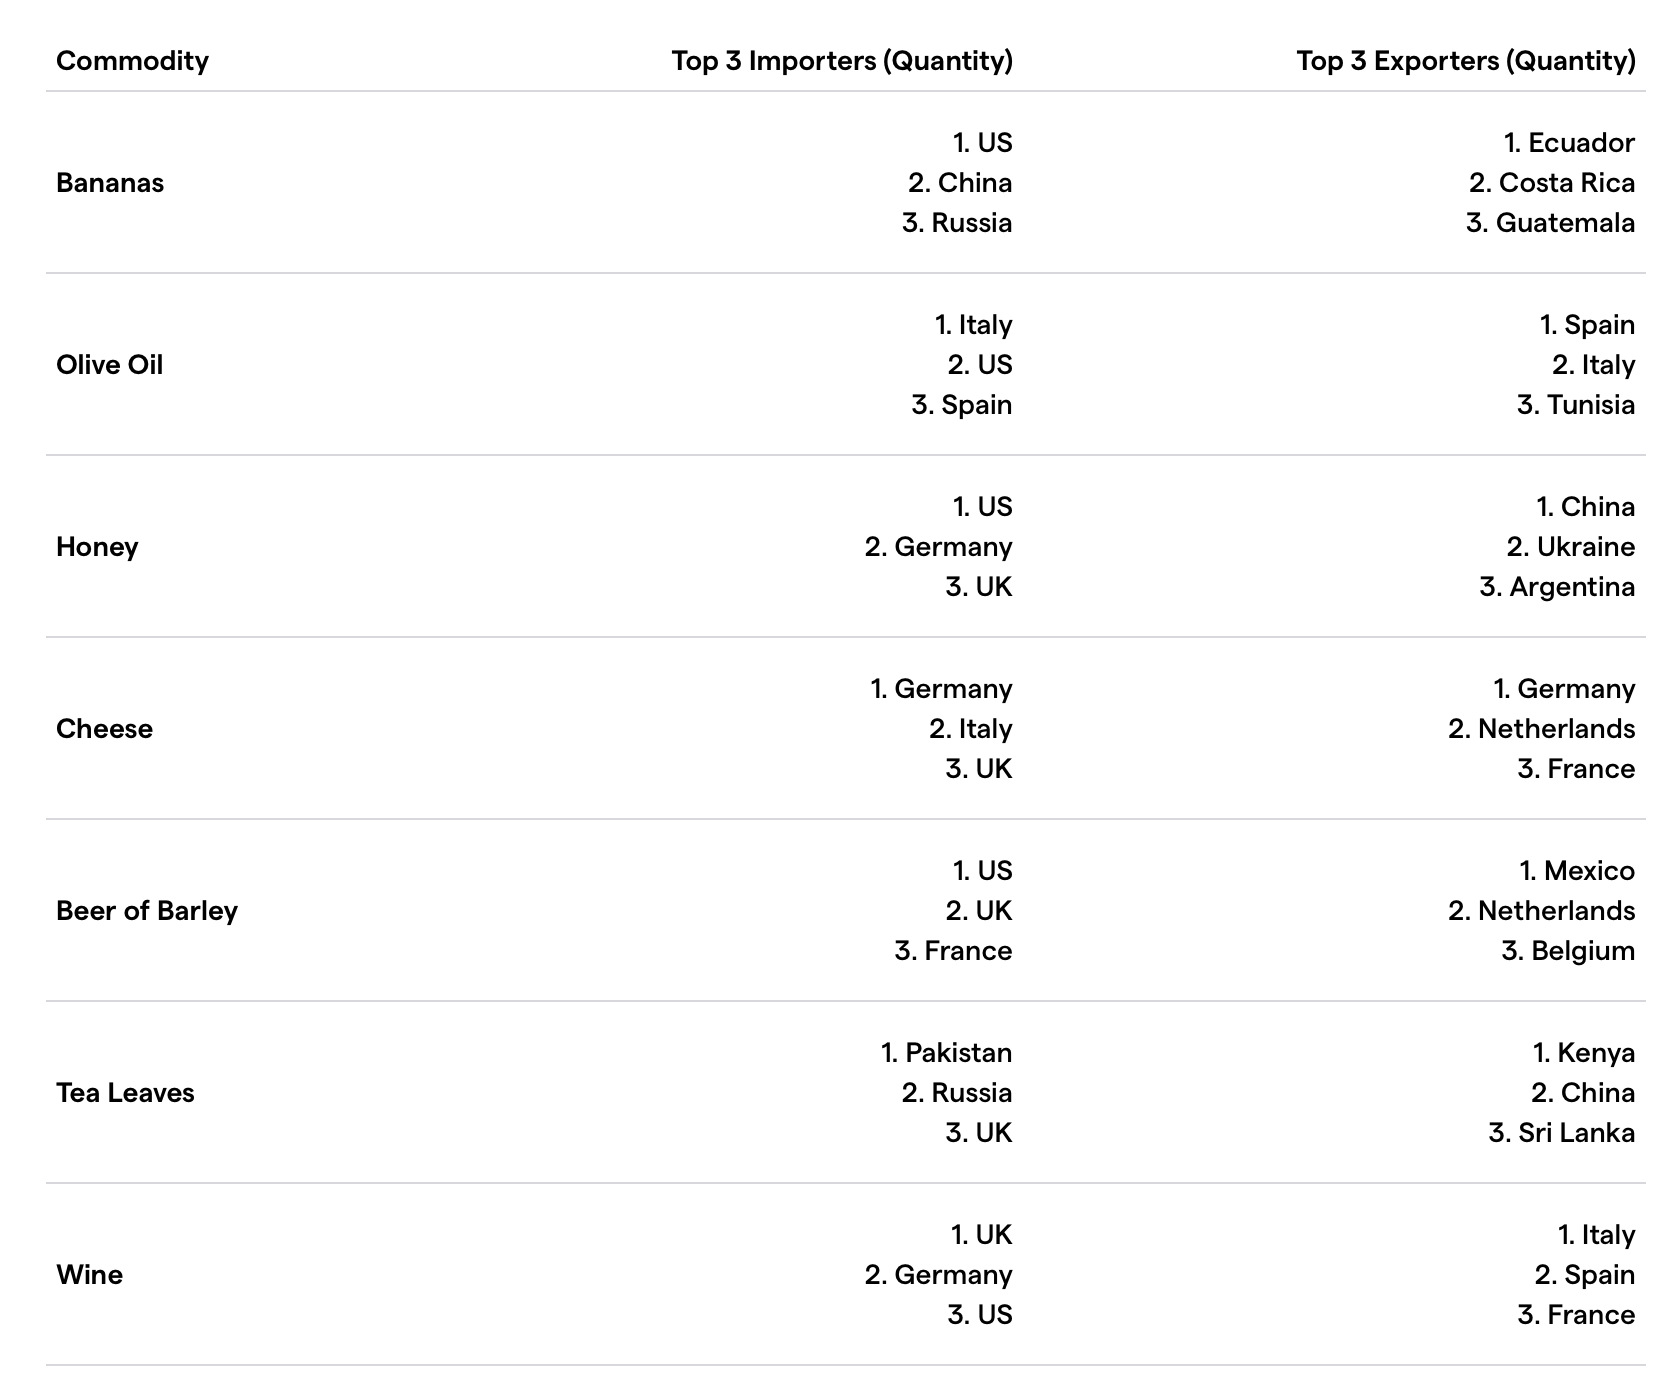
FAO data revealed that bananas were the most imported food in 2020, with the US being the largest importer. Bananas’ high import quantity is likely due to their durability, as they can stay fresh for up to a week. Following bananas, Beer of Barley was the next most imported food. Despite ranking third in import quantity, wine had a significantly higher import value. Cheese ranked fourth in import quantity but also had a high import value. Notably, both wine and cheese surpassed beer in terms of import value.
Food has moved around the world ever since Europeans brought tea from China, but efficient modern transportation and bioengineering has made it more practical to bring food from distant places where labor costs and farm expenses may be cheaper. Nowadays, it is not only tropical foodstuffs such as sugar, coffee, chocolate, tea, and bananas that are shipped long distances to come to our tables but also fruits and vegetables that once grew locally, in household gardens and on small farms. An apple imported to Washington from New Zealand is often less expensive than an apple from the historic apple-growing county of Okanogan, just a few hours away from Seattle. And the global diffusion of mega-marts like Costco and Walmart have only accelerated this trend. It is estimated that the average American meal travels about 1500 miles to get from farm to plate. Why is this cause for concern? There are many reasons:
- This long-distance, large-scale transportation of food consumes large quantities of fossil fuels. It is estimated that we currently put almost 10 kcal of fossil fuel energy into our food system for every 1 kcal of energy we get as food.
- Transporting food over long distances also generates great quantities of carbon dioxide emissions. Some forms of transport are more polluting than others. Airfreight generates 50 times more CO2 than sea shipping. But sea shipping is slow, and in our increasing demand for fresh food, food is increasingly being shipped by faster – and more polluting – means.
- To transport food long distances, much of it is picked while still unripe and then gassed to “ripen” it after transport, or it is highly processed in factories using preservatives, irradiation, and other means to keep it stable for transport and sale. Scientists are experimenting with genetic modification to produce longer-lasting, less perishable produce.
- Source: Data from FAO at https://www.fao.org/faostat/en/#data/TCL. Tables with information using these data from IG Group Holdings plc., a UK-based trading provider. Online: https://www.ig.com/en/news-and-trade-ideas/a-worldwide-view--the-most-imported-and-exported-foods-230605 ↵
