
Chapter 10: Agricultural and Food Systems
10.5 Agricultural Economics
We know that climate and terrain place physical limits on what can be grown in certain locations on Earth. However, we must also take into account the geographic nature of the choices farmers make when deciding what to plant. Once subsistence farming intensifies to the point of producing more food than it requires to feed a family or local community, it makes financial sense for farmers to sell their excess products.
10.5.1 Cheap Corn, Large Waistlines
In this shift from substance to commercial agriculture farms need to be profitable; and the more profitable, the better, so farmers carefully choose the crops and animals they raise. These decisions, in turn, affect what we eat. You might be thinking, “Farmers don’t control what I eat. I just eat what tastes good”, but opinions vary wildly on the issue of taste preference from country to country, and even within the countries. Taste preferences for food vary within and across ethnicities, and even house to house among people that would seem alike in almost every way. Still, there are trends that characterize regions, in the US, and around the world, many of these foodways have roots in the local geography of a place. It is often said, “you are what you eat,” but geographers might add the rejoinder “what you eat depends on where you eat.” Family traditions determine largely what people eat, but understanding the evolution of those traditions requires an analysis of the spatial contexts in which they evolved. Our ethnic heritage explains much of our taste preferences. European immigrants to the US established most American foodways. Europeans living 300 years ago would have readily recognized many American dietary staples, such as beef, pork, chicken, bread, pasta, cheese, and milk, as well as a number of the fruits and vegetables we commonly eat. Modern Americans also copy foodways borrowed from the indigenous people of the Americas. Less prominent elements of American’s diet are traceable to Asia and Africa.

Source: “VegCorn” via Wikimedia Commons is in the public domain.
Eating is a daily ritual, and as such, it is a deeply ingrained cultural routine. What you like to eat is probably not that different from what your parents and grandparents like to eat. The same was true for your grandparents, giving dietary habits exceptional staying power. This fact is part of the reason behind our obesity crisis. Our lifestyle has changed as rapidly as technology and the economy has evolved, but many of our foodways are stubbornly resistant to change. The diets that served our ancestors who were farmers or laborers engaged in strenuous daily activities, provides too many calories and fat for a generation working and living in the information age. Cultural lag is the term that describes the inability of cultural practices to keep pace with changes in technological advancement. Numerous behaviors exhibit cultural lag, and culturally conservative regions exhibit a greater degree of cultural lag than places with more progressive tendencies A sizeable portion of the American diet is purely American. We have adopted a number of foodstuffs favored by Native Americans. Maize, better known in America as “corn,” is perhaps the most American part of our diet. Domesticated by the indigenous people of Mexico thousands of years ago, it has proven a versatile and hardy plant. It’s so versatile that today much of the world eats maize in some fashion. Most Americans know maize mostly as sweet corn. Americans eat sweet corn like corn on the cob, but also canned, frozen and fresh “off the cob,” and in a variety of dishes.
.JPG#/media/File:Klip_kukuruza_uzgojen_u_Me%C4%91imurju_(Croatia).JPG)
Source: “Klip kukuruza uzgojen u Međimurju (Croatia)” by Silverije via Wikimedia Commons is licensed under CC BY-SA 3.0.
Less well known are maize varieties known as field corn, although it is far more common because of its great versatility. Field corn is too hard to eat raw, so we modify it. Some of it is processed into cornmeal or cornstarch, which we in turn use to make things like corn chips, tortillas and sauces. We also consume a lot of corn syrup and high fructose corn syrup (HFCS) made from field corn. Corn syrups are used as a sweetener, thickeners, and to keep foods moist or fresh. HFCS is an inexpensive replacement for cane and beet sugars, and therefore is the most common sweetener used in processed foods and soft drinks. Several scientists suspect corn sweeteners play a significant role in the obesity crisis in the United States, and elsewhere. Some critics argue that although it tastes nearly the same, the human body responds differently to HFCS than traditional sugars. They argue that since HFCS replaced cane sugar as the most common sweetener, a variety of health issues have appeared in the US and elsewhere. Of course, the corn industry disputes such charges. Since this isn’t a biology course, there is no reason to wade into a discussion of human metabolism, but it is appropriate to illustrate how geography partly explains why we use HFCS in such vast quantities.
Several reasons explain the use of HFCS, rather than granulated sugars, including cane sugar and beet sugar. Cost is the obvious reason, but why HFCS is cheaper has a lot to do with geography. First, corn grows well in much of the US, so farmers can flood the market and drive down prices. Sugar cane and sugar beets, on the other hand, are less well adapted to American climates. Sugar cane grows best in a rainy subtropical or tropical climate and to be profitable requires a very long, warm growing season. Only Hawaii, parts of Texas, Louisiana and Florida can profitably produce sugar cane. Cane yield is highly dependent on climate, and only Hawaii’s climate is ideal in the US. Cane yields in Hawaii are triple those in Louisiana. Sugar beets are more widely grown in the US because they grow well in multiple climates. California and Minnesota both produce sugar beets. Half of the US granulated sugar production is made from beets. Climate and labor conditions outside the US make foreign sugar much cheaper than domestic sources.
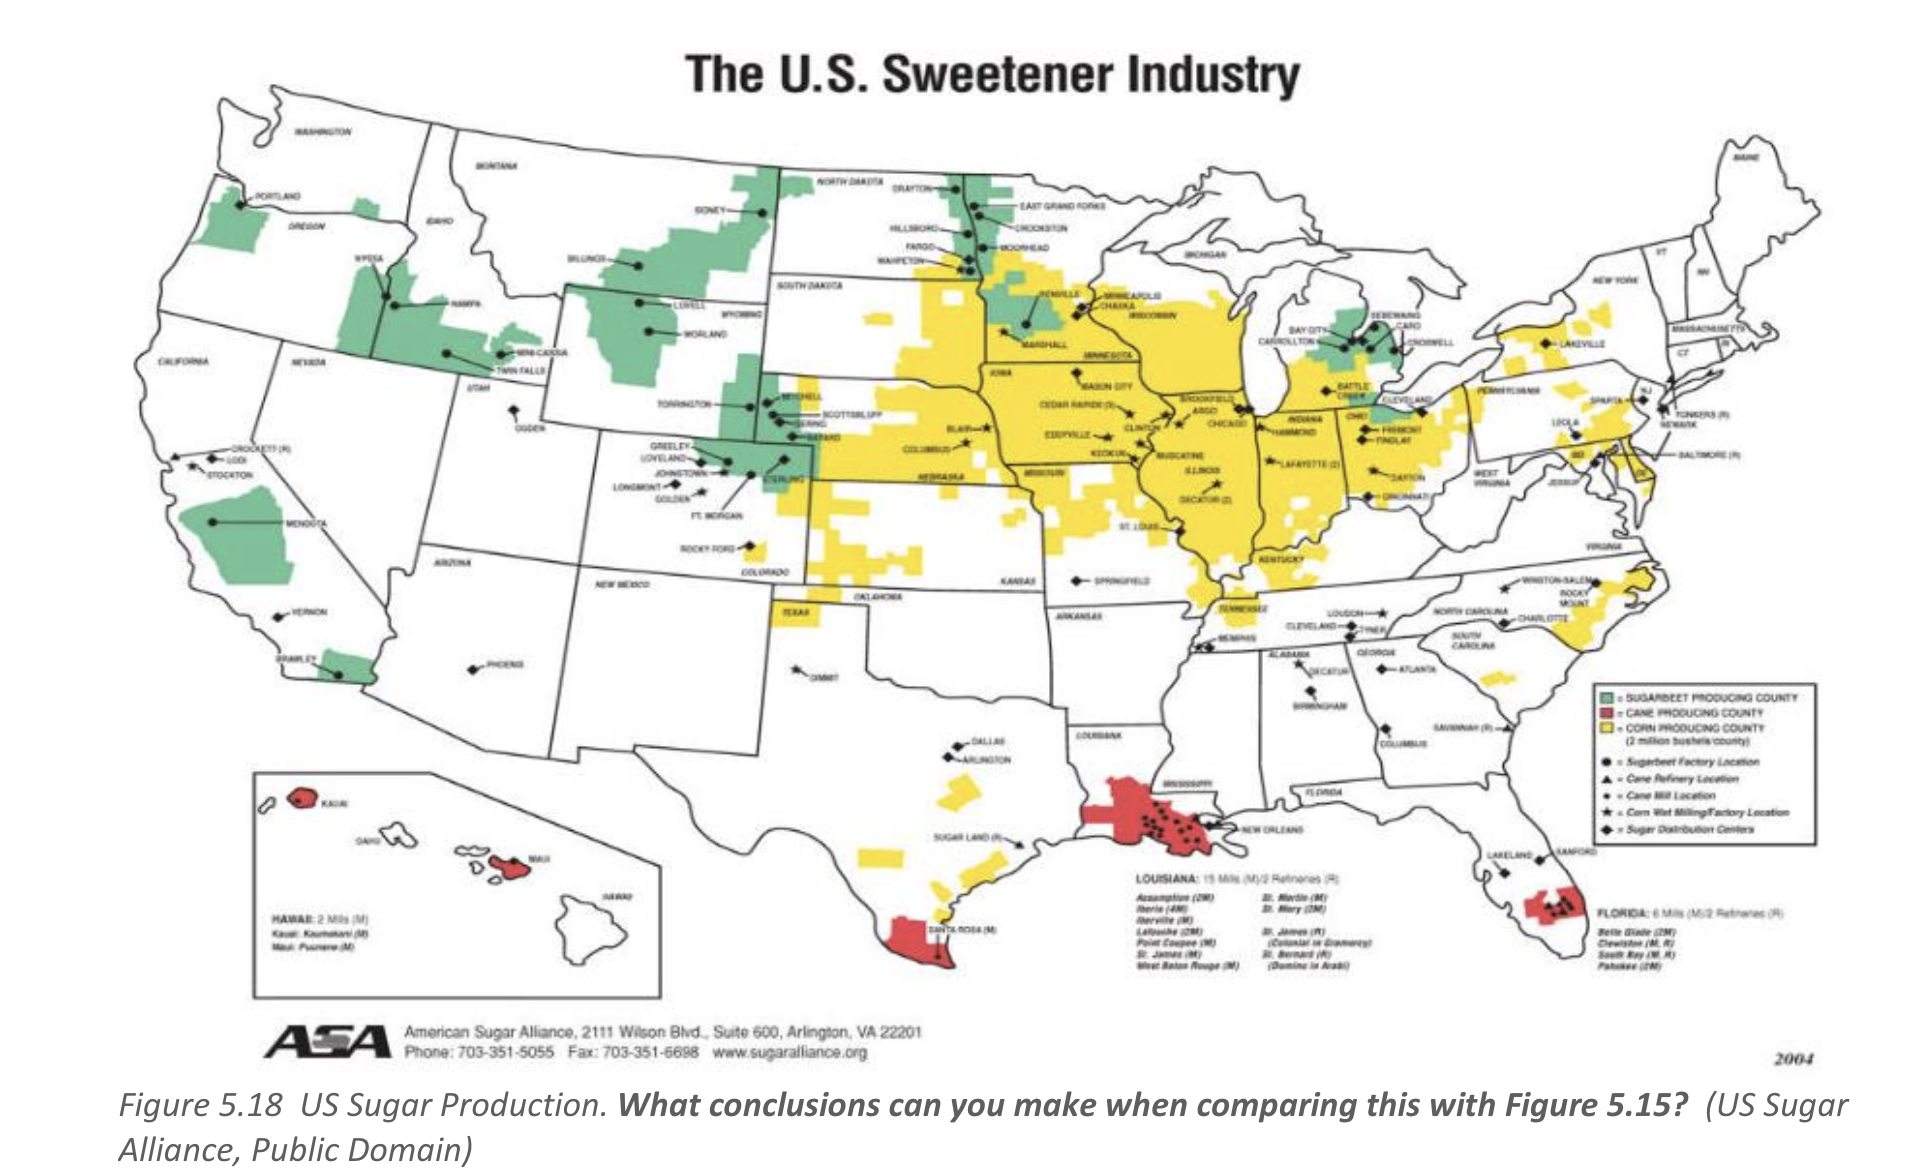
Source: “US Sugar Production. What conclusions can you make when comparing this with Figure 5.15?” (US Sugar Alliance, Public Domain)

Source: “America’s Sweetest Industry” by American Sugar Alliance (ASA).
For more information check this Fruit Explorer blog on sugar production.
The other main reason HFCS is far less expensive than granulated sugar is US government policies. First, the government provides massive subsidies to the corn industry, helping drive down the price of HFCS. At the same time, the US government provides special subsidies to cane sugar producers through tax breaks and incentives. The US government even buys sugar that farmers cannot sell at an above world market price. More importantly, the US government restricts sugar imports, especially from Cuba, an otherwise cheap source of sugar for Americans. These trade protection policies help sugar farmers, but food processors and consumers wind up paying higher prices for cane sugar and sugar-sweetened foods than they would under free market conditions. As a result, food processors use HFCS. The nearly $8 billion subsidy paid to corn farmers is four times greater than that paid to the sugar beet and cane industry. This has consequences. One is that there is a huge surplus of corn. In 2014, there were about 1.63 billion bushels of corn left unsold.
Some years it’s higher. One side effect is that people eat only a tiny fraction of the field corn grown in the US directly. About half of the yearly field corn crop is used to make biofuels, particularly ethanol that is blended with gasoline by many petroleum companies. If you own a car, corn is probably in your gas tank; and your lungs if you live in a smoggy location. The other half of the corn crop becomes animal feed. Farmers use both the grain and the silage, to feed cattle. Farmers feed corn to chickens and hogs as well. Even cat and dog foods often have corn in it. Exceptionally cheap corn helps make meat less expensive than many other types of food. College students on a budget already know that it is a lot cheaper to buy lunch at a local fast-food burger joint than a healthy green salad. Government policies also shape school lunch programs. Kids get cheap, often unhealthy, food and return agribusiness benefits. In 2011, the US Congress even declared pizza sauce and ketchup “vegetables” for the sake of school lunches to help specific agribusiness interests. The inexpensiveness of unhealthy meats and grains increases the incentives for their consumption, often in the form of fast food. In impoverished regions of the US, fast food is more widely available than elsewhere. Spatially, we can track the impact of these agricultural policies on the geography of the United States.

Source: “Obesity and Fast Food Restaurants” by LukeB4uleap via Wikimedia Commons is licensed under CC BY-SA 3.0.
10.5.2 Small-Scale vs Large-Scale Farming
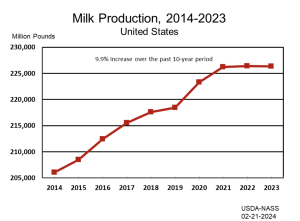
Source: “Milk Production, 2014-2023” USDA-NASS, 02-21-2024
The economics of agriculture don’t just impact our waistline. They impact who farms the land. Small-scale farms are far more impacted by fluctuations in the price of their goods because they are often dependent on one specific product. Conversely, large-scale commercial farms can spread out their economic risk among several products, larger stock or even multiple locations, in the case of a devastating weather event, crop catastrophe or price fluctuation. An example of this can be seen in the dairy farming in the Unites States. A major transformation of dairy farming has reduced the number of farms by nearly 60 percent over the past 20 years, even as total milk production increased by onethird. Recent results from the Census of Agriculture and the Agricultural Resource Management Survey (ARMS) detail how and why the structure of dairy production has changed. The mean herd size of dairy farms rose from 61 cows in 1992 to 144 in 2012, but most cows are now on farms that are much larger than average. The midpoint farm size is used to track cows; the midpoint shows the herd size at which half of all cows are in larger herds and half are in smaller herds. In 1992, the midpoint of 101 cows was not much larger than the mean, reflecting the fact that most cows were small and mid-size dairy farms. However, the midpoint rose sharply over the next two decades, to 900 cows by 2012, over six times larger than the mean herd size.
In the simplest terms, your milk is most likely coming from a largescale commercial farm rather than your local family-owned dairy. (Check out the Where is My Milk From website) The shift to larger dairy farms is driven largely by the economics of dairy farming. Average costs of production, per gallon of milk, are lower in larger herds because production and distribution are more efficient. These costs include the estimated costs of the farm family’s labor as well as resource costs.

Source: ” Farms, land in farms, and average acres per farm, 1850-2023” USDA, Economic Research Service using data from USDA, National Agricultural Statistics Service, Census of Agriculture (through 2022) and Farms and Land in Farms: 2023 Summarv (Februarv 2024)
The cost differences reflect differences in input use; on average, larger farms use less labor, capital, and feed per gallon of milk produced. This is known as economy of scale and is the reason starting and maintaining small and mid-sized farming operations can be so difficult. A large dairy owner can make a deal with other farmers to purchase enormous amounts of corn, soybeans, and hay at a discount to feed their milk cows while a small-scale farmer is more likely to pay a higher retail price. In addition to the costs associated with running a commercial agricultural operation, small-scale dairy farmers are highly impacted by the price of milk. There are many factors that influence milk prices in the United States, including state and federal programs designed to ensure that milk prices don’t fall so low that dairy producers can’t cover the cost of production. Non-governmental organizations, such as dairy cooperatives, also play a role in determining minimum pricing. Based on The Farmer’s Share Infographic, July 2024 price estimates from USDA, U.S. farmers and ranchers received $1.76 for a gallon of fat-free milk selling retail at $4.39; about 40%. Most of the 60% not received goes for marketing, processing, wholesaling, distribution and retailing. Check this website for more insightful and mind-numbing numbers.
