
Chapter 10: Agricultural and Food Systems
10.3 Agricultural Regions
10.3.1 Land Cultivation
There has always been a delicate balance between how much of the Earth’s surface can be used for agriculture and its ability to produce enough food to sustain a growing population. Climate, terrain, ground water and soil composition create limits on what and where crops can be produced without major human adaptations to the landscape. New technologies and scientific knowledge have helped to increase the world’s cultivated land significantly. However, spatial variations in land resources like rainfall and temperature zones are still the most significant factors in determining what land is suitable for certain crops and types of agriculture.

Source: “Major uses of land, 1959-2012” from USDA, Economic Research Service using data from the Major Land Uses data product; see sources in Bigelow el al., 2017
The world’s cultivated land has grown by 12 percent over the last 50 years, mostly at the expense of forest, wetland and grassland habitats. At the same time, the global irrigated land has doubled. The distribution of these land and water assets is unequal among countries. Although only a small part of the world’s land and water is used for crop production, most of the easily accessible and thus economic resources are under cultivation or have other ecologically and economically valuable uses. Therefore, the ability to expand more cultivated land is limited. Only parts of South America and sub-Saharan Africa still offer a scope for some expansion. At the same time, competition for water resources has also been growing to the extent that today more than 40 percent of the world’s rural population is now living in waterscarce regions.

Source: “Global-land-use-graphic” by Hannah Ritchie and Max Roser via Wikimedia Commons is licensed under CC BY-SA 4.0.

Source: “Long-term-change-in-land-use” by Hannah Ritchie and Max Roser via Wikimedia Commons is licensed under CC BY 4.0.
The total global land area is 13.2 billion hectare (ha). A hectare is a metric system area unit and widely used land measurement for agriculture and forestry; it equals to 10,000 square meters. Of this, 12 percent (1.6 billion ha) is currently in use for cultivation of crops, 28 percent (3.7 billion ha) is under forest, and 35 percent (4.6 billion ha) comprises grasslands and woodland ecosystems. Low-income countries cover about 22 percent of the land area, but they account for 38 percent of the global population. Land use varies with climatic and soil conditions and human influences.
Figure 10.3.4 shows the dominant land use by region. Deserts prevail across much of the lower northern latitudes of Africa and Asia. Dense forests predominate in the heartlands of South America, along with the seaboards of North America, and across Canada, Northern Europe and much of Russia, as well as in the tropical belts of Central Africa and Southeast Asia. Cultivated land is 12 to 15 percent of total land in each category.
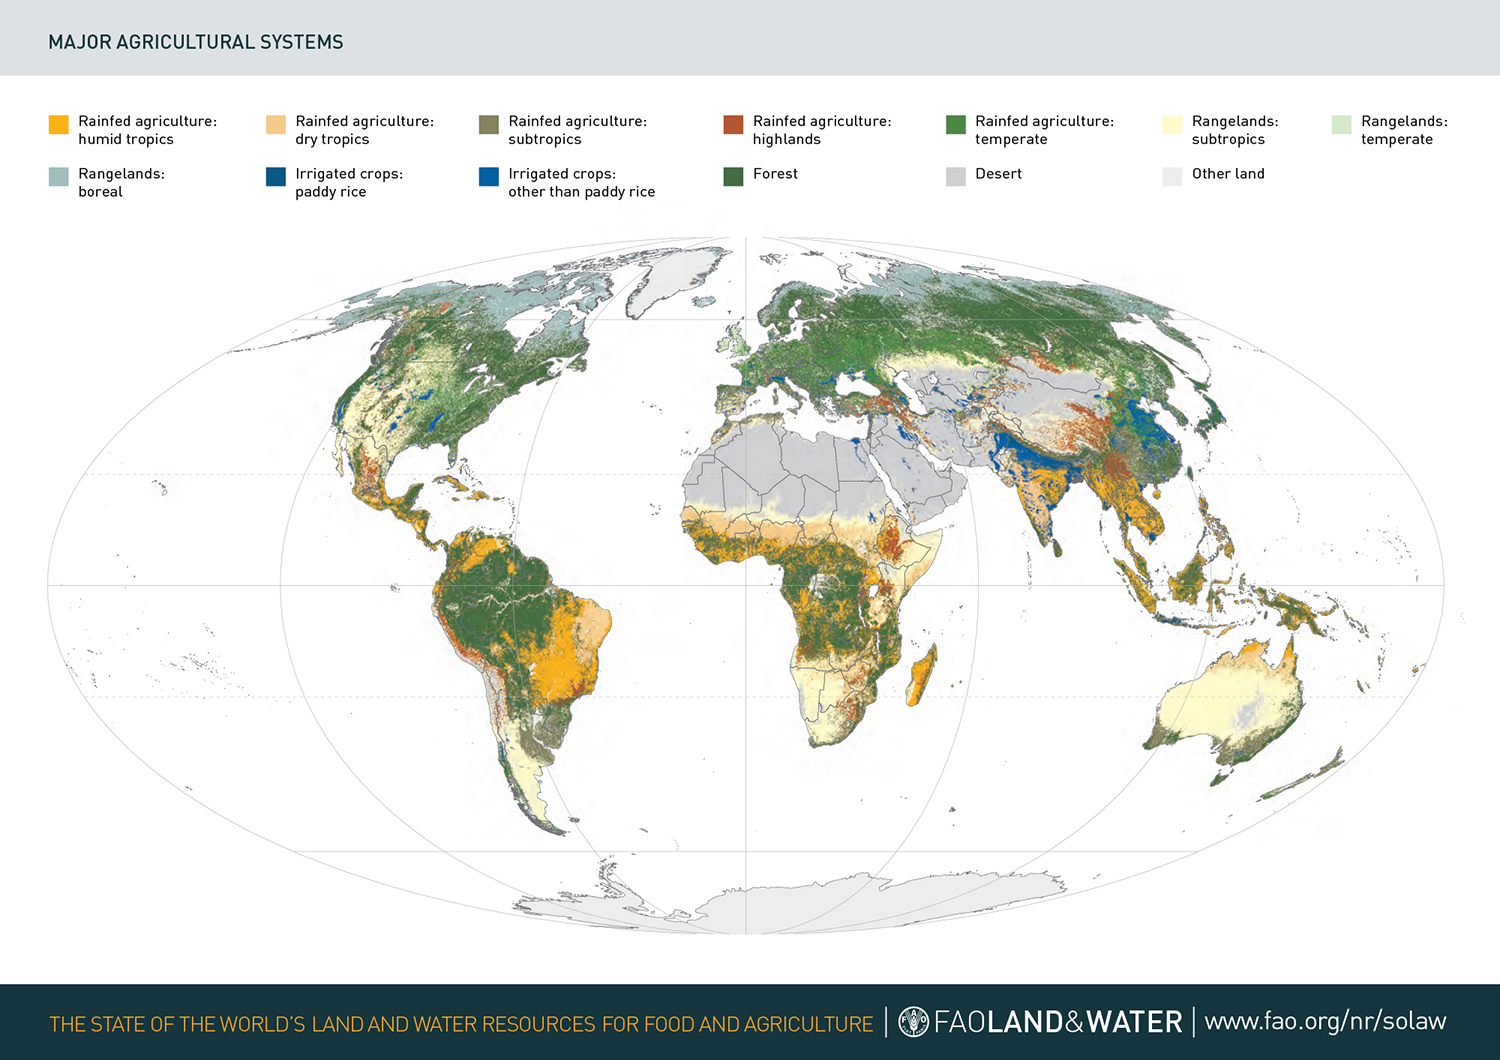
Source: “Major agricultural systems” from The State of the World’s Land and Water Resources for Food and Agriculture (SOLAW, 2011).
Cultivated land is a leading land use (a fifth or more of the land area) in South and Southeast Asia, Western and Central Europe, and Central America and the Caribbean, but is less important in sub-Saharan and Northern Africa, where cultivation covers less than a tenth of the area. In low-income countries, soils are often poorer, and only 28 percent of the total cultivated land is suitable for high yield crops. It is also important to note that with overall growth in cultivated land, rain-fed croplands have declined slightly and irrigated cropland has more than doubled in the time between 1961-2008. This helps us to understand the ways in which humans have adapted the landscape for agricultural purposes.
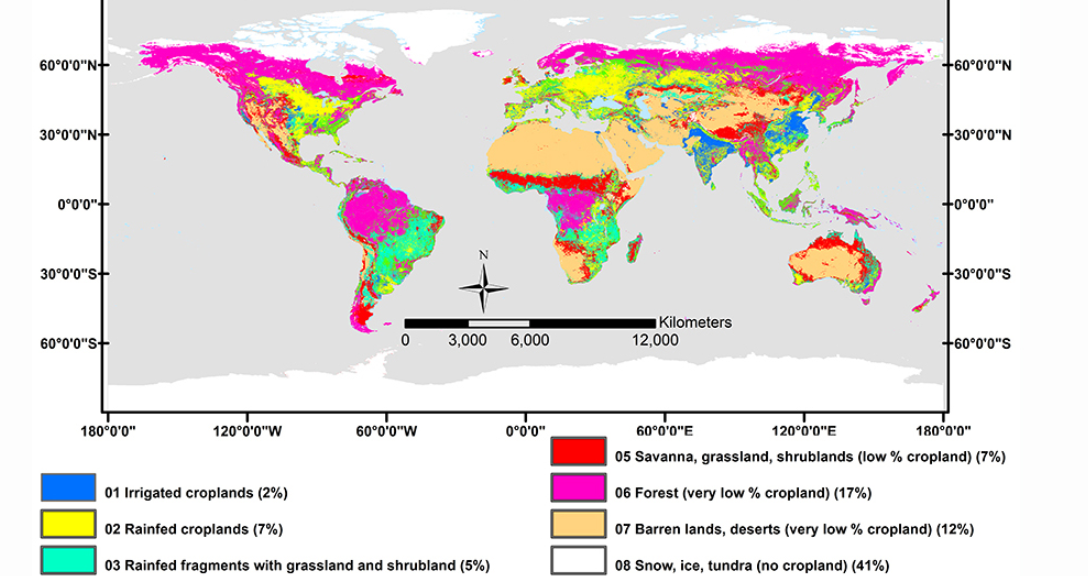
Source: ““GFSAD30 Figure A” by Western Geographic Science Center, Courtesy: Dr. Prasad Thenkabail, USGS
10.3.2 Irrigation and Water Scarcity
Water resources available for irrigation are very unevenly distributed, with some countries having an abundance of water while others live in conditions of extreme scarcity or shortage of water. Also, even where water may appear abundant, much of it is not accessible or is very expensive to develop, or is not close to lands that can be developed for agriculture.

Source: “U.S. acres of irrigated land by county, 2017” from USDA, Economic Research Service using data from USDA, National Agricultural Statistics Service, 2017 Census of Agriculture.
Water scarcity has three dimensions: 1. physical – the available supply does not satisfy the demand, 2. infrastructural – the infrastructure in place does not allow for satisfaction of water demand by all users and 3. institutional – institutions and legislations fail to ensure reliable, secure and equitable supply of water to users.
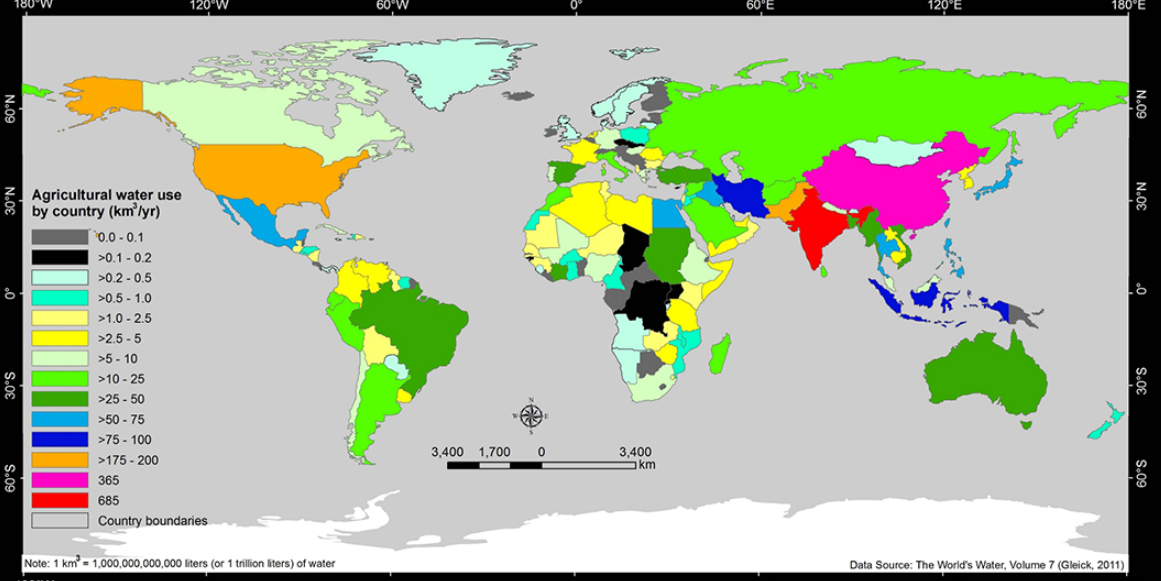
Source: “GFSAD30 Figure 2 – Global cropland water use” by Western Geographic Science Center, Courtesy: Dr. Prasad Thenkabail, USGS
In some regions, particularly in the Middle East, Northern Africa and Central Asia, countries are already using water resources more than what is available. The resultant stresses on ecosystems such as salinization of the soils are increasingly apparent. It is now estimated that more than 40 percent of the world’s rural population lives in river basins that are, physically, water-scarce.
At the same time, in more developed countries, urban and industrial demand, has been growing faster than agricultural demand. Whereas in lower income countries agricultural use remains dominant, in Europe 53 percent of water is used by industry, 26 per cent is for agriculture and 19 per cent for household use but with wide variations between countries.[1]
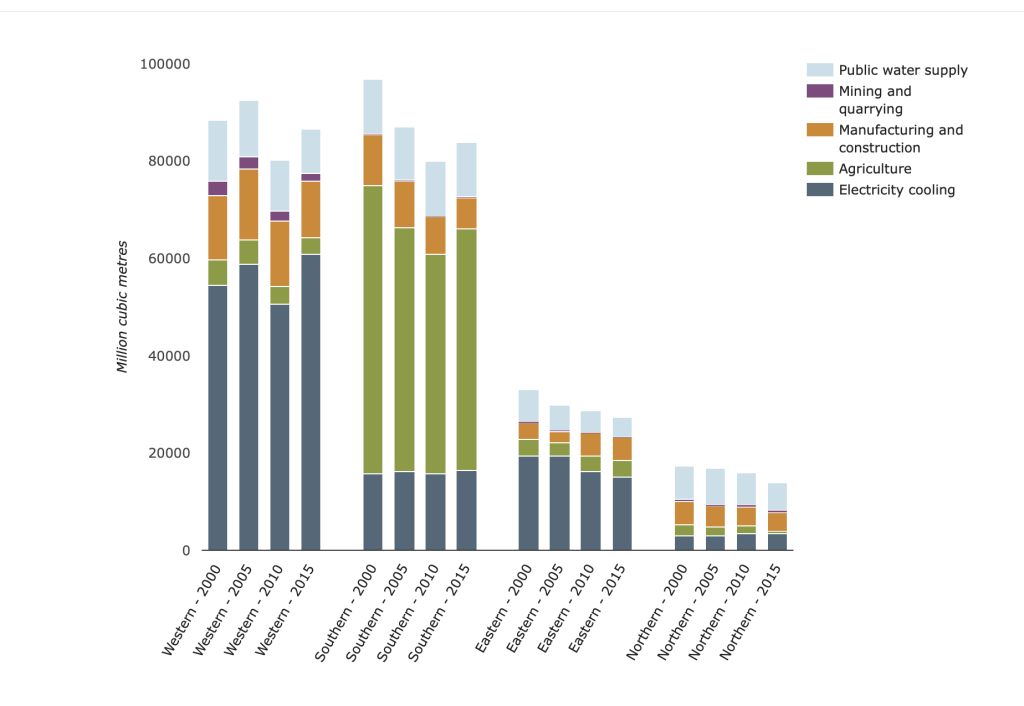
Source: “Water abstraction by sector, EU” European Environment Agency
Water stresses occur locally across the globe, but some entire regions are highly stressed, particularly the Middle East, the Indian sub- continent and northeastern China. Sub-Saharan Africa and the Americas experience lower levels of water stress. The quality of water is also impacted when run-off returns to the environment.
In general, increasing population and economic growth combined with little or no water treatment have led to more negative impacts on water quality. Agriculture, as the largest water user, is a major contributor. Key pollutions include nutrients and pesticides derived from crop and livestock management. Rain-fed agriculture depends on rainfall for crop production, with no permanent source of irrigation. Rain-fed agriculture produces about 60 percent of global crop output in a wide variety of production systems (see the table above). The most productive systems are concentrated in temperate zones of Europe, followed by Northern America, and rain-fed systems in the subtropics and humid tropics. Rain-fed cropping in highland areas and the dry tropics tends to be relatively low- yielding, and is often associated with subsistence farming systems. Evidence from farms worldwide shows that less than 30 percent of rainfall is used by plants in the process of cultivation. The rest evaporates into the atmosphere, percolates to groundwater or contributes to river runoff.
- The European Environment Agency, The Problems of Water Stress, ↵
