
Chapter 1: Introduction to Geography
1.4 Geography – The Physical and Human Geographic Perspectives
1.4.1 The Physical Geographic Perspective
When we describe places, we can discuss their absolute and relative location and their relationship and interaction with other places. However, understanding the physical characteristics of Earth’s landscape is equally crucial, as these aspects often influence human settlement patterns and regional development. A geographer can dig deeper and explore both the physical and human characteristics that make a particular place unique. You might be a physical geographer who studies hurricanes, but your research includes the human impact from these events. Or, you might be a human geographer who studies food, but your investigations include the ecological impact of agricultural systems. Ultimately, the physical dimensions of geography form the foundation for understanding the complex relationships between people and their environments.
Much of Earth’s physical landscape, from mountains to volcanoes to earthquakes to valleys, has resulted from the movement of tectonic plates. As the theory of plate tectonics describes, these rigid plates are situated on top of a bed of molten, flowing material, much like a cork floating in a pot of boiling water. There are seven major tectonic plates and numerous minor plates.

Source: “Tectonic plates.png” in the public domain in the United States because it only contains materials that originally came from the United States Geological Survey, an agency of the United States Department of the Interior.
Where two tectonic plates meet is known as a plate boundary, and boundaries can interact in three different ways. Where two plates slide past one another is called a transform boundary. The San Andreas Fault in California is an example of a transform boundary. A divergent plate boundary is where two plates slide apart from one another. (Check for a visualization of the boundaries in Figure 1.4.2 below.) Africa’s Rift Valley was formed by this type of plate movement. Convergent plate boundaries occur when two plates slide towards one another. In this case, where two plates have roughly the same density, upward movement can occur, creating mountains. The Himalaya Mountains, for example, were formed from the Indian plate converging with the Eurasian plate. In other cases, subduction occurs and one plate slides below the other. Here, deep, under-ocean trenches can form. The 2004 Indian Ocean earthquake and tsunami occurred because of a subducting plate boundary off the west coast of Sumatra, Indonesia.
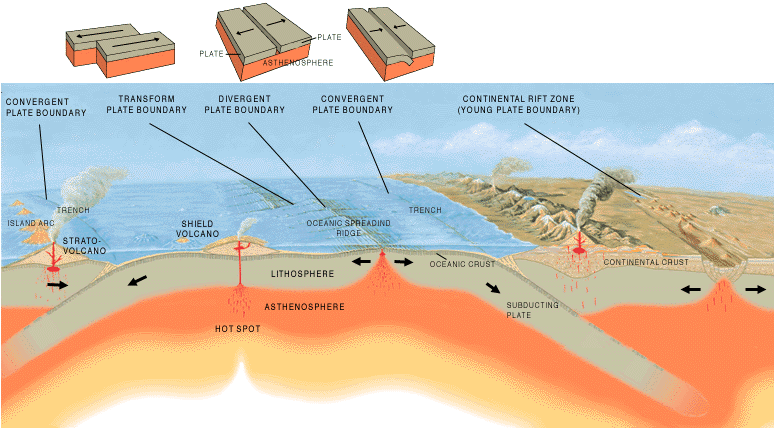
Source: Cross section by José F. Vigil from This Dynamic Planet — a wall map produced jointly by the U.S. Geological Survey, the Smithsonian Institution, and the U.S. Naval Research Laboratory.
The interaction between tectonic plates and historical patterns of erosion and deposition have generated a variety of landforms across Earth’s surface such as plains, valleys, mountains, and major water bodies. Topography refers to the study of the shape and features of the surface of the Earth.
Another key feature of Earth’s physical landscape is climate. First, we must differentiate between the terms weather and climate. Weather refers to the short-term state of the atmosphere. We might refer to the weather as partly sunny or stormy, for example. Climate, on the other hand, refers to long-term weather patterns measured over many years and is affected by a place’s latitude, terrain, altitude, and nearby water bodies.
Geographers commonly use the Köppen climate classification system to refer to the major climate zones found in the world.

Source: “Koppen-Geiger Map v2 World 1991–2020” by Beck, H.E., McVicar, T.R., Vergopolan, N., Alexis, B., Lutsko, N.J., Dufour, A., Zeng, Z., Jian, X., van Dijk, A.I.J.M., Miralles, D.G. via Wikimedia Commons is licensed under CC BY 4.0.
Each climate zone in the Köppen climate classification system is assigned a lettered code, referring to the temperature and precipitation patterns found in the particular region. Climate varies widely across Earth. Cherrapunji, India, located in the CWB climate zone, receives over 11,000 mm (400 in) of rain each year. In contrast, the Atacama Desert (BWk), situated along the western coast of South America across Chile, Peru, Bolivia, and Argentina, typically receives only around 1 to 3 mm (0.04 to 0.12 in) of rain each year.

Source: NASA’s Goddard Space Flight Center
Earth’s climate has gone through significant changes historically, alternating between long periods of warming and cooling. Since the industrial revolution in the 1800s, however, global climate has experienced a warming phase. 95 percent of scientists agree that this global climate change has resulted primarily from human activities, particularly the emission of greenhouse gasses like carbon dioxide.
According to NASA’s Earth’s Observatory that keeps track on the Annual Global Temperature Records, 2023 was the hottest year on record following many other years having had the ‘hottest year on record’ distinction.
“In 2023, hundreds of millions of people around the world experienced extreme heat, and each month from June through December set a global record for the respective month. July was the hottest month ever recorded. Overall, Earth was about 2.5 degrees Fahrenheit (or about 1.4 degrees Celsius) warmer in 2023 than the late 19th-century average, when modern record-keeping began.” NASA Earth’s Observatory.
1.4.2 The Human Geographic Perspective
The physical setting of the world’s places has undoubtedly influenced the human setting; just as human activities have shaped the physical landscape. There are currently more than 8 billion people in the world, but these billions of people are not uniformly distributed. When we consider where people live in the world, we tend to cluster in areas that are warm and are near water and thus avoid places that are cold and dry. There are three major population clusters in the world: East Asia, South Asia, and Europe as can be seen encircled on the map.

Source: by Dickinson High School Derivative work from original “2006megacities-1-.jpg” by Cocoliras via Wikimedia Commons is licensed under CC BY-SA 3.0.
Just as geographers can discuss “where” people are located, we can explore “why” population growth is occurring in particular areas. For instance, all of the 10 most populous cities in the world are located in countries traditionally categorized as “lower and middle income” These countries typically have high rates of population growth which is usually expressed as total fertility rate (TFR).. A population grows, quite simply, when more people are born than die. The global TFR has more than halved over the past 70 years, from around five children for each female in 1950 to 2.2 children in 2021—with over half of all countries and territories (110 of 204) below the population replacement level of 2.1 births per female as of 2021. This trend is especially concerning for countries like South Korea and Serbia, where the total fertility rate is below 1.1 children per woman. However, in many sub-Saharan African nations, fertility rates remain high. In 2021, the TFR for the region was nearly double the global average, at four children per woman. Chad, in particular, had the highest TFR in the world, with an average of seven births per woman.
A number of factors influence the total fertility rate, but it is generally connected to a country’s overall level of development. As a country develops and industrializes, it generally becomes more urbanized. Children are no longer needed to assist with family farms, and urban areas might not have large enough homes for big families.
In addition, women increasingly enter the workforce, which can delay childbearing and further restrict the number of children a family desires. Culturally, a shift occurs when industrialized societies no longer value large family sizes. As women’s education increases, women are able to take control of their reproductive rights. Contraceptive use becomes more widespread and socially acceptable.
As countries industrialize and become more developed, they shift from primarily rural settlements to urban ones. Urbanization refers to the increased proportion of people living in urban areas. As people migrate out of rural, agricultural areas, the proportion of people living in cities increases. As people living in cities have children, this further increases urbanization. For most of human history, we have been predominantly rural. Globally, by the middle of 2008 the number of people living in urban areas surpassed the number of people living in rural areas for the first time. In 2024, 43 percent of the world’s population lived in rural areas. This is expected to decrease slowly.
Figure 1.4.6 More than 50% of people living in urban and rural areas per country. Ourworldindata
The number of megacities, cities with 10 million people or more, has also increased. In 1990, there were 10 megacities in the world. In 2024, there were 33 megacities. Tokyo- Yokohama is the largest metropolitan area in the world with over 38 million inhabitants.
